Last updated at Thu, 04 Mar 2021 17:25:52 GMT
Organizations are in a constant struggle to identify and reduce risks in their constantly changing environments. These changes may manifest by several means and can be recurring events.
For example:
- Laptops and other devices are commissioned or decommissioned due to changes in the workforce.
- Your security tool discovers that assets in your environment contain several vulnerabilities recently discovered by researchers.
- New software or services are deployed to your organization that introduce new risk via new vulnerabilities.
- Your IT team deployed a round of patches to local assets, which significantly decreased the number of vulnerabilities in your environment.
The obvious challenge here is that these changes create moving targets and security teams need to quickly identify, prioritize and remediate risk as it’s introduced. We developed our Significant Changes in the Last 30 Days dashboard in InsightVM in order to provide a lens through which we can highlight the differences in your environment from the past 30 days to present day, as well as the ability to pivot the findings into a Remediation Project directly from the dashboard.
Users may easily create this dashboard by selecting the template titled “Significant Changes in the Last 30 days.” This action will create a local copy of the dashboard for you and save three new asset queries in your query library. These queries are:
- Assets Discovered in the Last 30 Days,
- Critical Vulnerabilities Discovered in the Last 30 Days
- Vulnerabilities Discovered in the Last 30 Days
These queries all filter the cards on the dashboard, and we’ve added the ability to view the queries applied to this Dashboard, which will allow you to further focus the finding on the dashboard.
Users are completely able to add and remove cards as they wish. However, the following cards are included in the template:
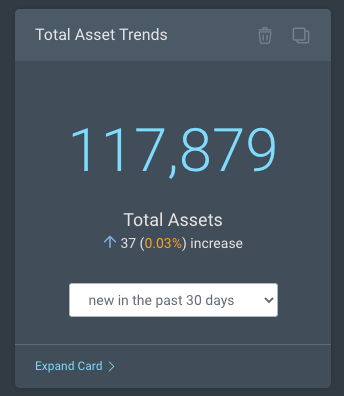
Total Asset Trends
This card shows the total number of assets in your environment, as well as the total number of new assets in the past 30 days and the total percentage of increase.
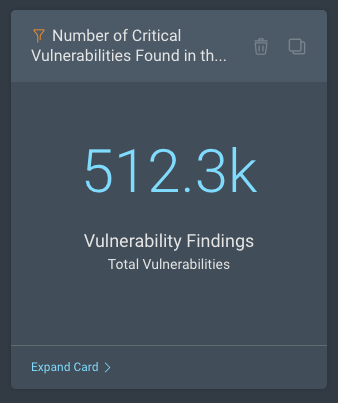
Number of Critical Vulnerabilities Found in the Last 30 Days
These are the total number of vulnerabilities with a severity of “critical” found within the last 30 days of the current date.
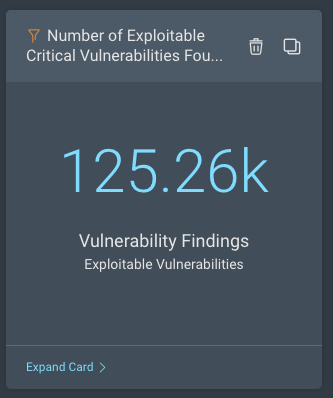
Number of Exploitable Critical Vulnerabilities Found in the Last 30 Days
This card shows all vulnerabilities with a severity of critical and known exploits. These provide a powerful view into vulnerabilities attackers could easily exploit.
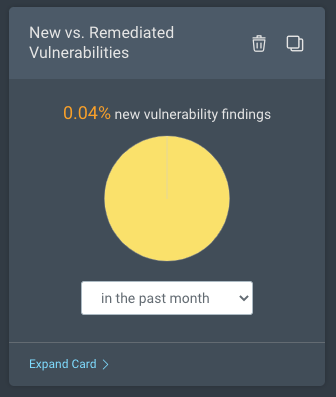
New vs. Remediated Vulnerabilities
This card shows the number and percentage of new, remediated, and unchanged vulnerability findings. This is powerful in showing which vulns in your environment have been addressed, which are new, and which have remained static.
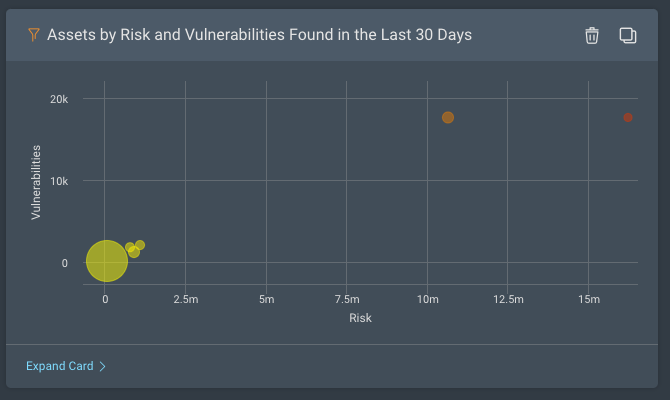
Assets by Risk and Vulnerabilities Found in the Last 30 Days
This visualization helps you identify the riskiest assets in your environment based on the number of vulnerabilities and the associated risk score. The size of the bubbles indicates how many assets exist for a given vulnerability count and risk score range.
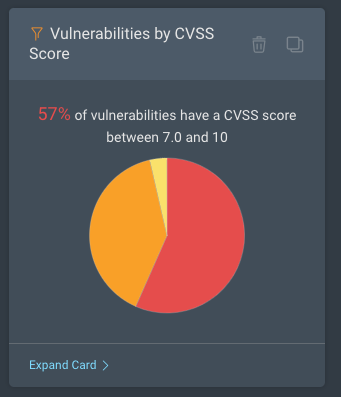
Vulnerabilities by CVSS Score
This card shows the vulnerabilities found in your environment in the past 30 days grouped by CVSS score range (e.g., CVSS 7.0–10).
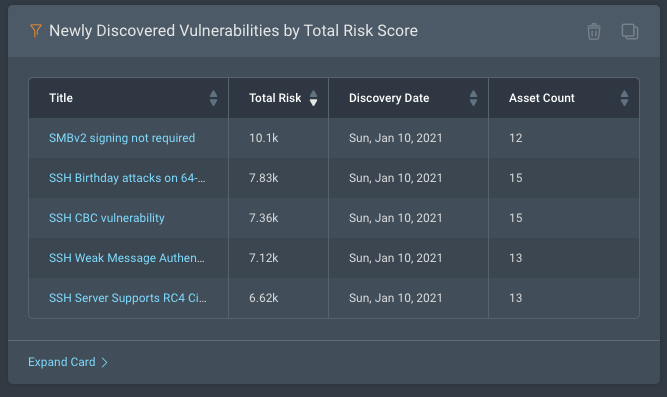
Newly Discovered Vulnerabilities by Total Risk Score
This card allows users to leverage our Real Risk score in order to identify and prioritize vulnerabilities discovered in the past 30 days.
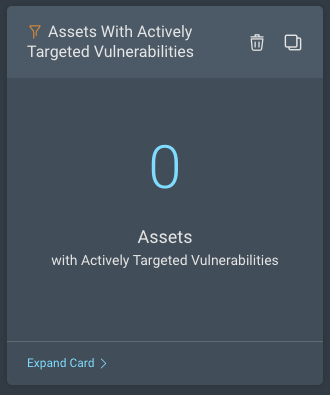
Assets With Actively Targeted Vulnerabilities
This card is intended to enable users to identify vulnerabilities that are actively being targeted in the wild, and therefore presenting a great degree of risk.
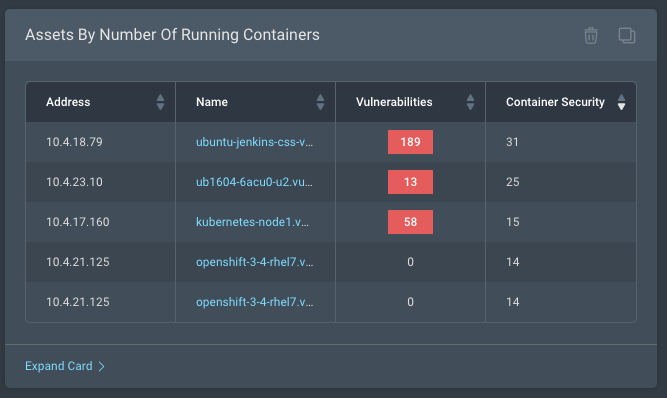
Assets by Number of Running Containers
This card is intended to identify risk exposure by showing container hosts and the total number of containers running on these.
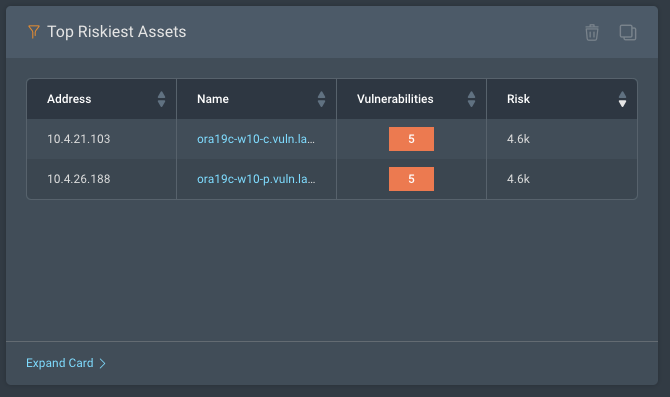
Top Riskiest Assets
This card lists the riskiest assets discovered in the past 30 days, allowing teams to prioritize remediations that will help reduce risk quickly.
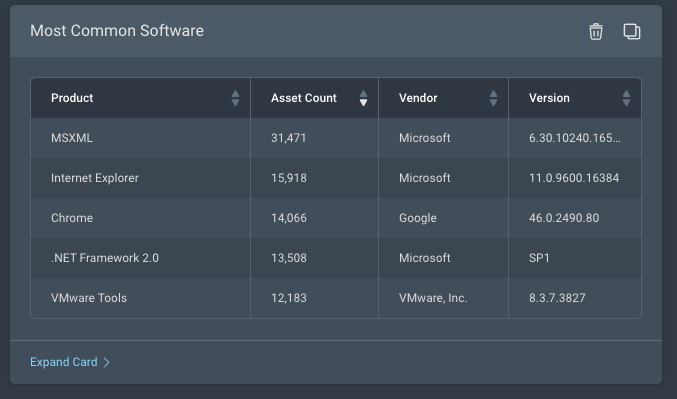
Most Common Software
This card shows the software most commonly used in their environment, allowing teams to prioritize their efforts at those items with the greatest surface area.
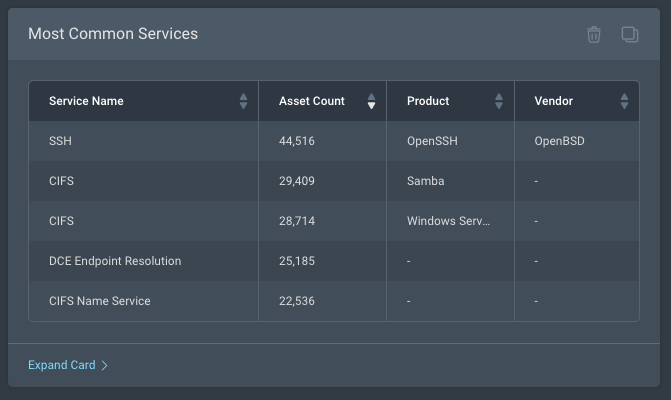
Most Common Services
This card shows the services most commonly deployed in their environment, giving them insight into what could be of the most importance.
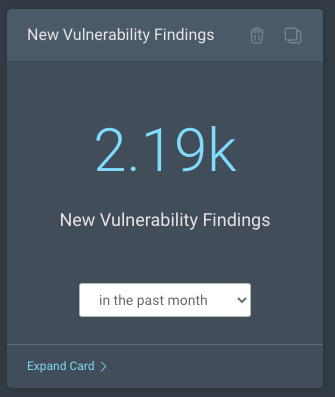
New Vulnerability Findings
This card shows the total number of vulnerability findings discovered in the past 30 days, and expanding this view shows a list of these. This allows teams to identify recent vulnerabilities and prioritize those accordingly.
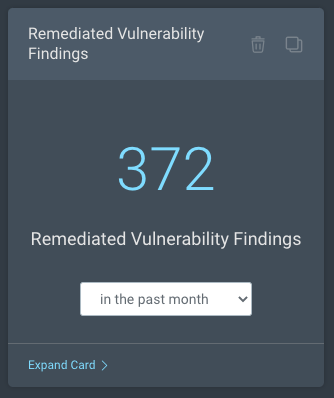
Remediated Vulnerability Findings
Finally, some positive news. This card demonstrates remediated vulnerabilities in the past 30 days, and this allows teams to demonstrate their progress on a monthly basis.
Per usual, users are able to arrange cards per their desires as well as share these with team members. We think this dashboard has the potential to provide deep visibility into changes in their environments and we hope this will help drive customers to a safer state.