Last updated at Wed, 05 Apr 2023 19:11:26 GMT
In case you missed it, we introduced Network Traffic Analysis for our InsightIDR and MDR customers a few months back. We took what was a very innovative traffic analysis system from NetFort, made it cloud-friendly, and integrated it with InsightIDR, our cloud SIEM platform.
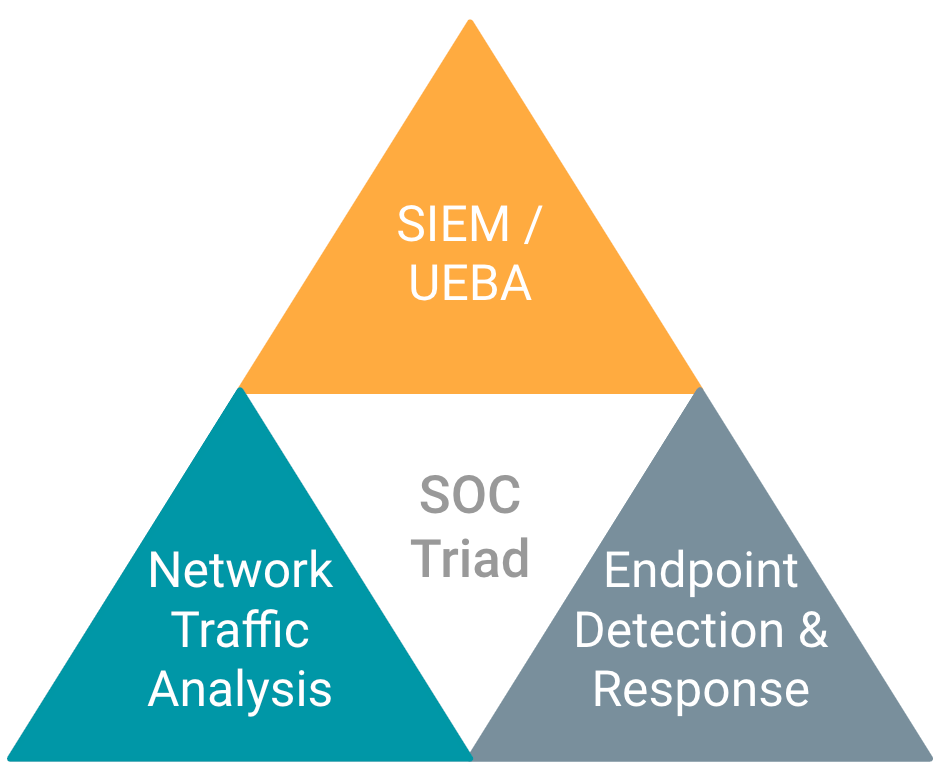
The addition of Network Traffic Analysis (NTA) to the Rapid7 portfolio ensures we are strongly aligned with Gartner’s Security Operations Visibility Triad, which advocates for a three-pronged approach to gain the visibility and analytics needed for successful incident detection and response.
From a single console, you can now deploy log readers, agents, and NTA components—with no need to log on and manage separate systems.
Vendor-independent and available at any location on any network, network data is a great option to eliminate blind spots or enable deeper visibility at critical locations. Every user and device on every network leaves a traffic trail. It is continuous, always on, and can be also used to improve real-time visibility into user activity in and out of the network (north-south) and also inside the network (east-west).
Network Traffic Analysis is available within InsightIDR and MDR via the Insight Network Sensor. This is an installable package for Linux systems. We have more information about the install process on our sensor help site. The Insight Network Sensor is available to all customers, and we also have an add-on available for customers who want access to network flow type data.
Network traffic use cases using standard Insight Network Sensor
All InsightIDR customers can download the Insight Network Sensor today and deploy it virtually, on a physical server, or both if they want visibility throughout their network. Once installed, a standard sensor provides three data types to InsightIDR:
- DNS metadata, which is passively captured from network traffic
- DHCP metadata, which is passively captured from network traffic
- IDS events from a Suricata module, which uses a curated rule set
Both the DNS and DHCP metadata are sent to existing log sets and are also used for attribution (user and assent) of other log data. The sensor is filling blind spots where logs are not available or may be incomplete. For example, this might be used to help correlate unknown hosts to IPs to Macs, if needed; we’ve also seen instances where the Sensor’s DNS collection may catch items that are missed by the DNS server.
“I definitely like the DHCP portion of the sensor... I am using it to help correlate unknown hosts to IPs to MACs if needed and the DNS actually catches some items that our DNS server is not always reporting”
Some customers are using the built-in IDS module for compliance needs where regulations may require an IDS in place. PCI-DSS is an example of a compliance standard that lists IDS as a core requirement. For other customers, they just want IDS to “find bad things that are happening inside my network.”
Leveraging insights from our MDR services team, we’ve curated a list of top IDS rules to eliminate that noise associated with traditional IDS tools and highlight the most priority issues early in the attack chain. As a result, you do not need a dedicated IDS professional keeping rules up-to-date, investigating, and tuning false positives.
In summary, if you want extra visibility of what devices are active on your network and you want network-based intrusion detection, the Insight Network Sensor is definitely worth checking out.
Network traffic use cases using sensors and network flow add-on
Advanced network traffic monitoring solutions like InsightIDR reduce the cost and complexity normally associated with traffic analysis. The Sensor’s deep packet inspection (DPI) engine performs the heavy lifting, using wire data analytics to capture and extract rich, readable metadata from raw network packets. They look within the metadata to see what payloads the packets contain. With the InsightIDR network flow data add-on, customers are accessing real-time information about user activity, application activity, web activity, etc. This includes:
- Rich metadata, with significant data reduction over traditional full packet capture
- Human-readable capabilities, which cuts down on distractions without compromising critical detail
- Accelerated investigations

Network data is easily searchable in InsightIDR alongside endpoint and log data to conduct investigations in one place (no need to jump between tools). This network data is available as an add-on for any customer who has deployed Insight Network Sensors.
Custom Dashboards
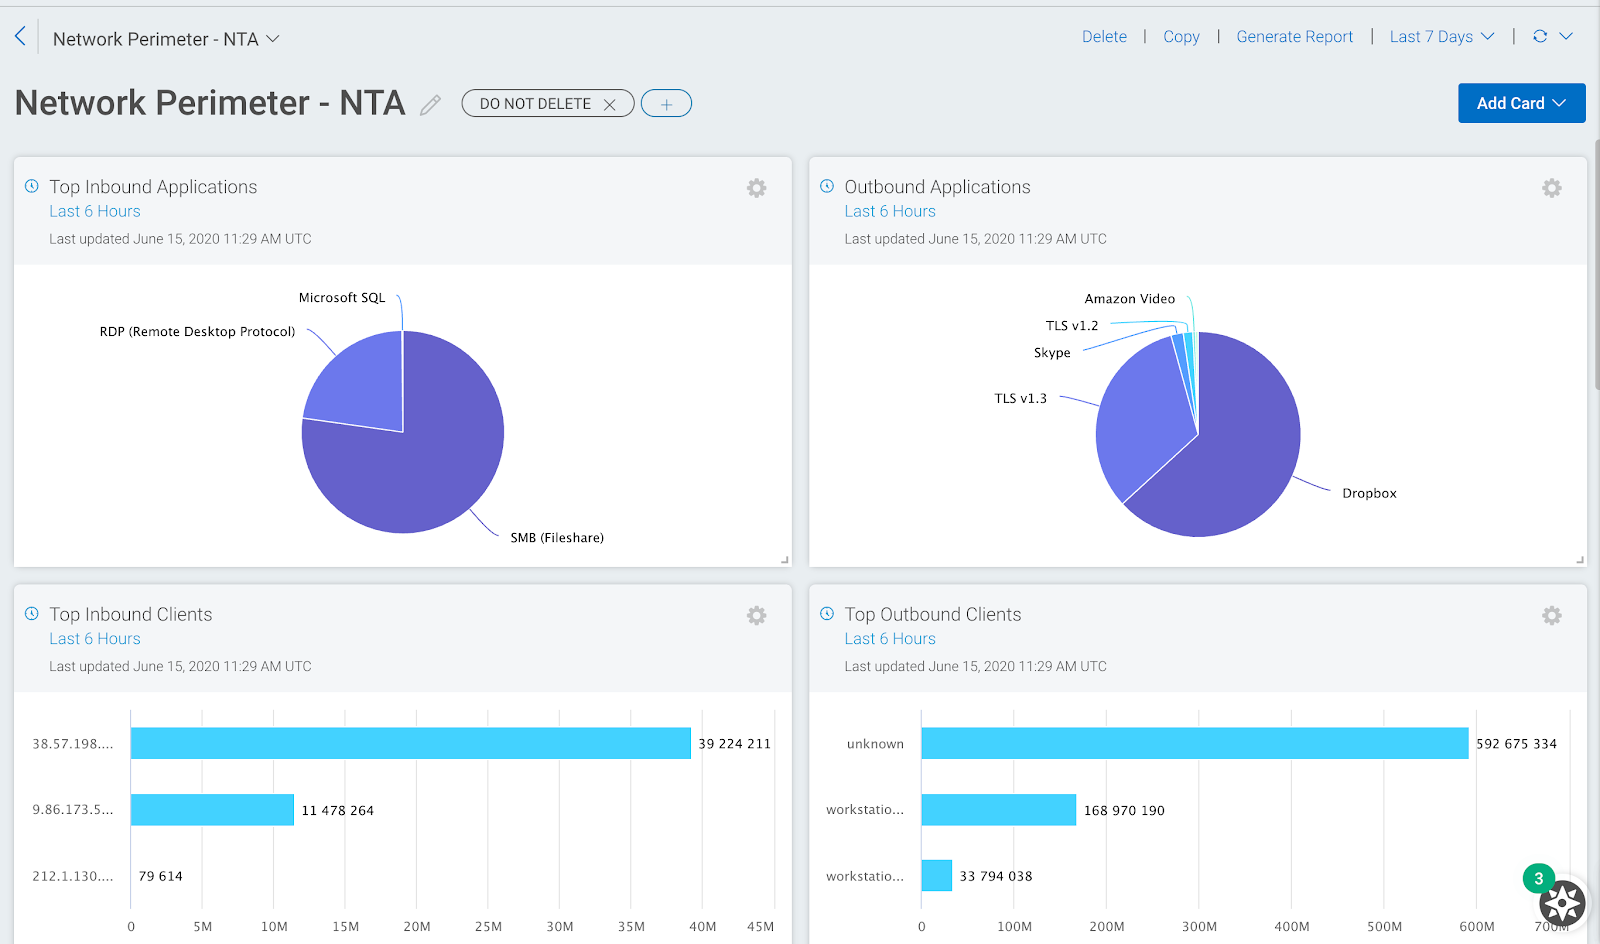
One thing that’s been especially exciting for our Product team since the launch of Network Traffic Analysis is to see how customers have been using this data for their own reporting and monitoring use cases. Many customers are building custom InsightIDR dashboards to improve real-time monitoring of network activity within their networks and at the edge. The image below shows a popular one that focuses on the network perimeter. This can be easily set up by going to the dashboard card library and selecting relevant reports from the network data sections. Other popular dashboards would be those that focus on WFH activity and dashboards which focus on east-west or internal network activity.
New data for investigations
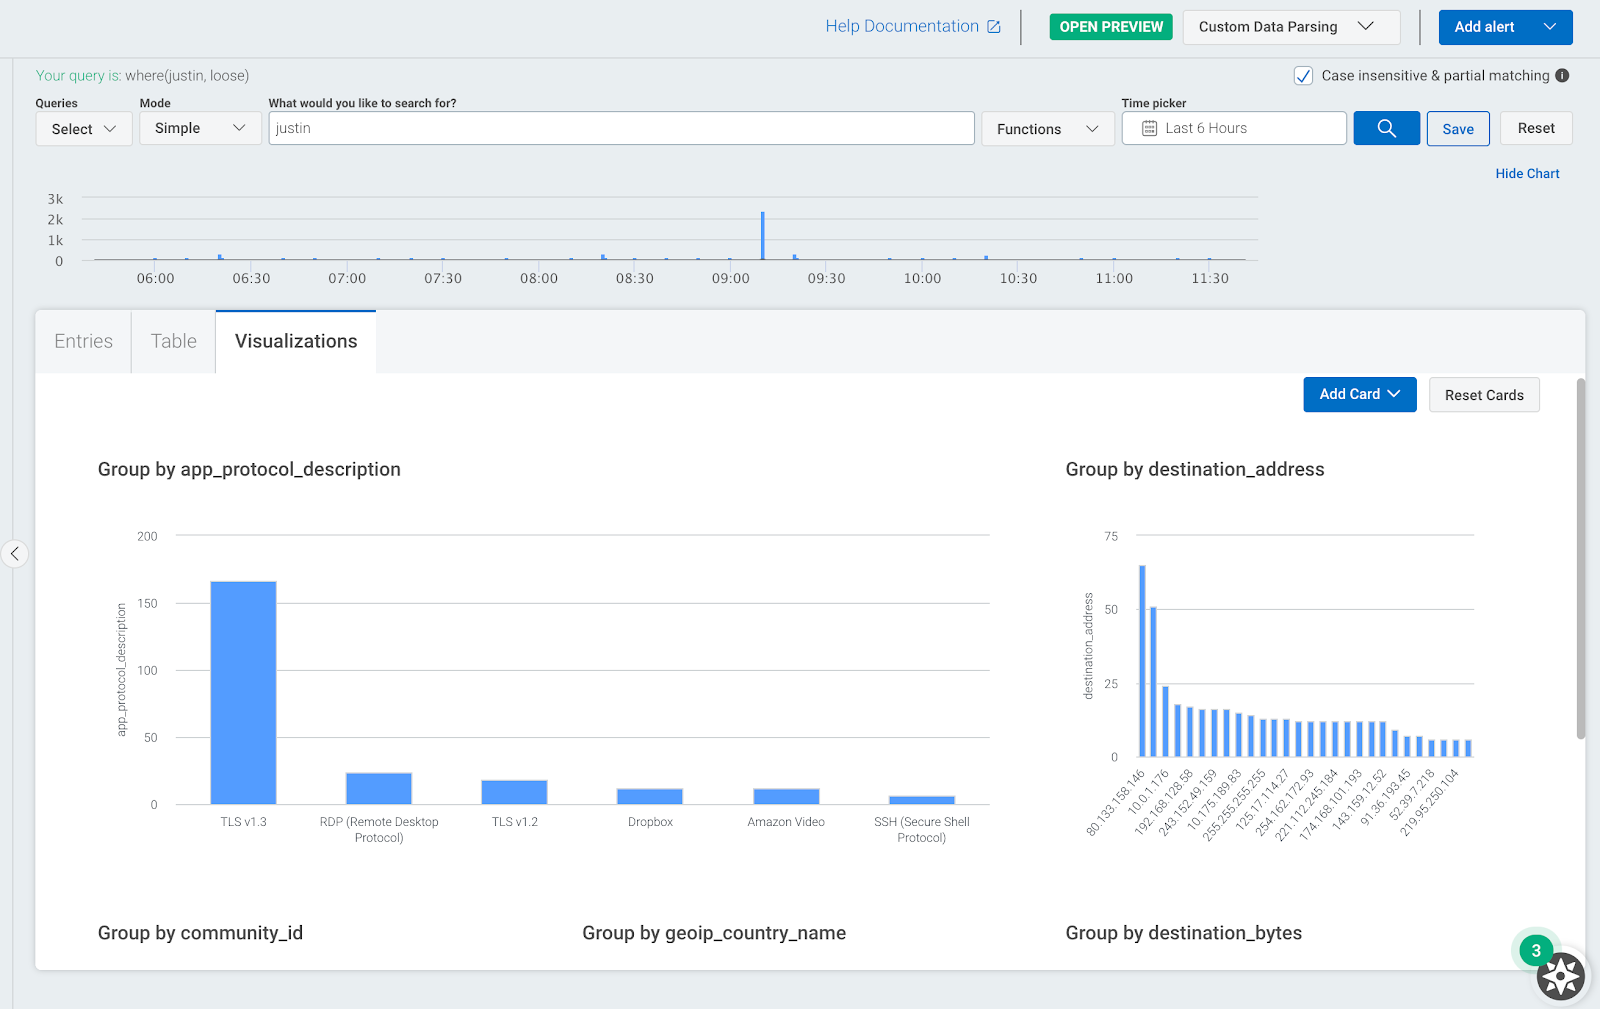
Network flow data can be used to speed up existing investigations, as you will have more information about specific users or devices on your network. The image below shows an example of this where we can see what applications and other network data are associated with a specific user.
New data for alerting
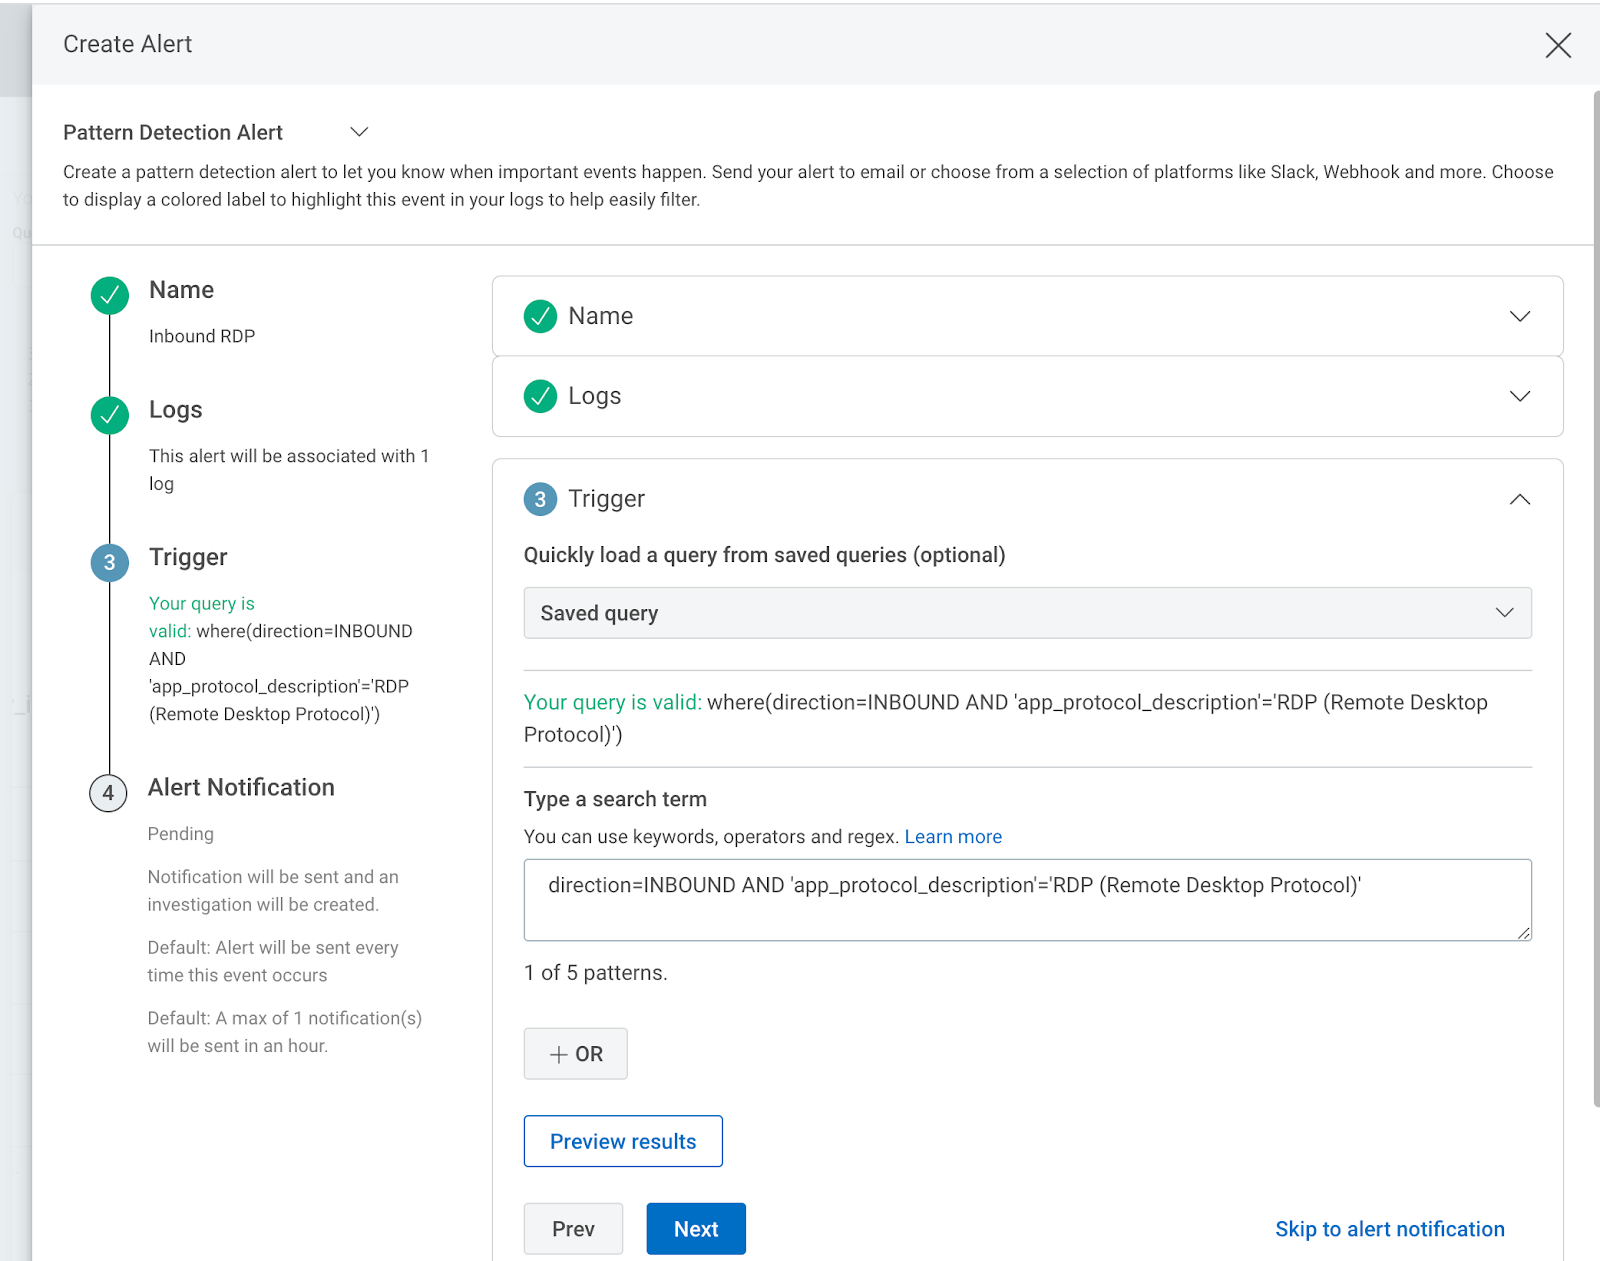
InsightIDR includes a comprehensive library of Attacker Behavior Analytics. These are used by customers and our MDR team to detect and investigate suspicious activity on networks. Customers can also create their own custom alerts, and using network flow data as a source is a popular use case for the Insight Network Sensor. The image below shows an example custom alert where we focus on any inbound RDP activity into the network.
Where to learn more?
- Learn more about the network traffic analysis capabilities in our SIEM tool, InsightIDR
- Watch an on-demand demo of InsightIDR and see the network traffic analysis features in action
- Get a free trial of InsightIDR. You will have the option to download the Insight Network Sensor to check out the visibility it can provide on your networks(s)