Last updated at Wed, 07 Feb 2024 21:43:34 GMT
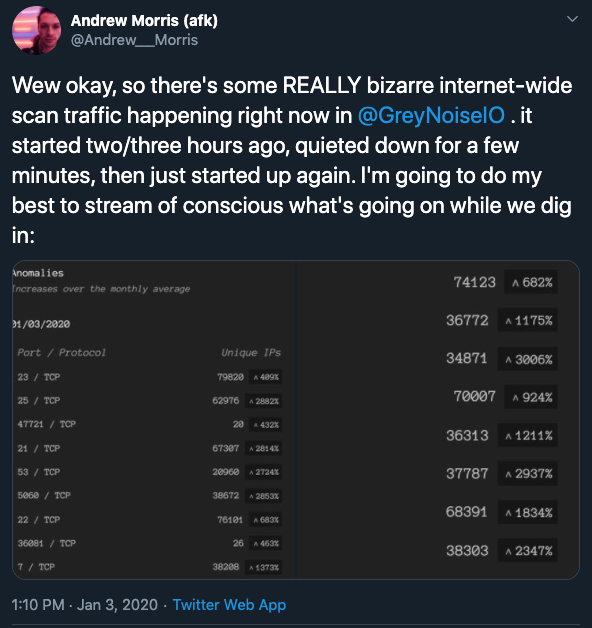
At the beginning of 2020, Rapid7 and other researchers began noticing increased scanning activity against a variety of TCP ports. Through our daily monitoring of connections to our Lorelei honeynet, as well as discussions with other community members such as Andrew Morris of GreyNoise, we felt confident that we were seeing something new—certainly not part of our “normal” traffic to the honeypots. The first public mention of this activity was actually on Jan. 3, when @Andrew__Morris tweeted:
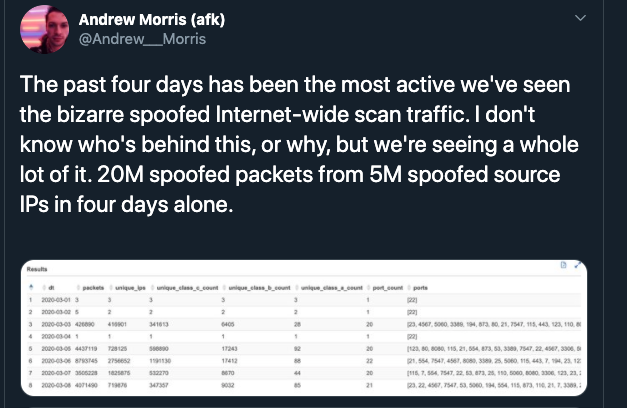
Over the following weeks, we noticed strange behavior on some ports like TCP 123, but had not noticed a continued phenomenon until March. On March 5, Greynoise again confirmed that they were also seeing the same sustained behavior we had seen in January and February.
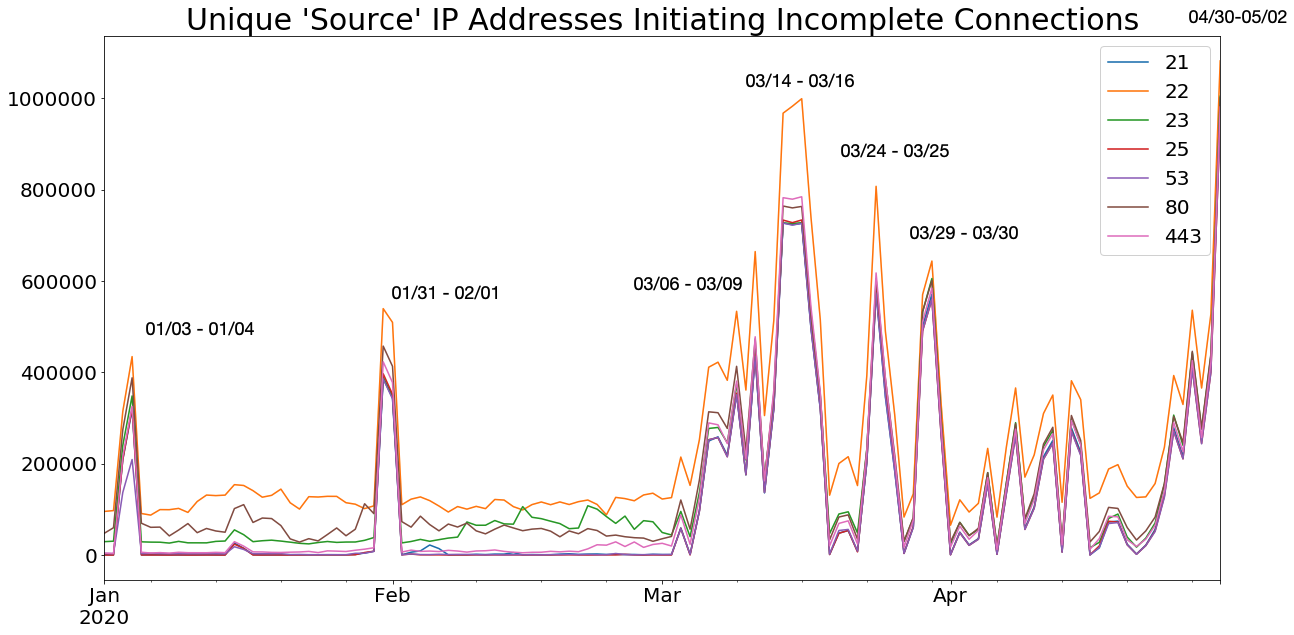
Once March hit, we were seeing consistently high numbers of unique IP addresses connecting to our honeypots. Primarily, we observed incredibly high volumes of SYN scanning activity against these TCP ports:
- 21 (FTP)
- 22 (SSH)
- 23 (Telnet)
- 25 (SMTP)
- 53 (DNS, more commonly seen on UDP RFC5966)
- 80 (HTTP)
- 110 (POP3)
- 123 (NTP, more commonly seen on UDP RFC5905)
- 443 (HTTPS)
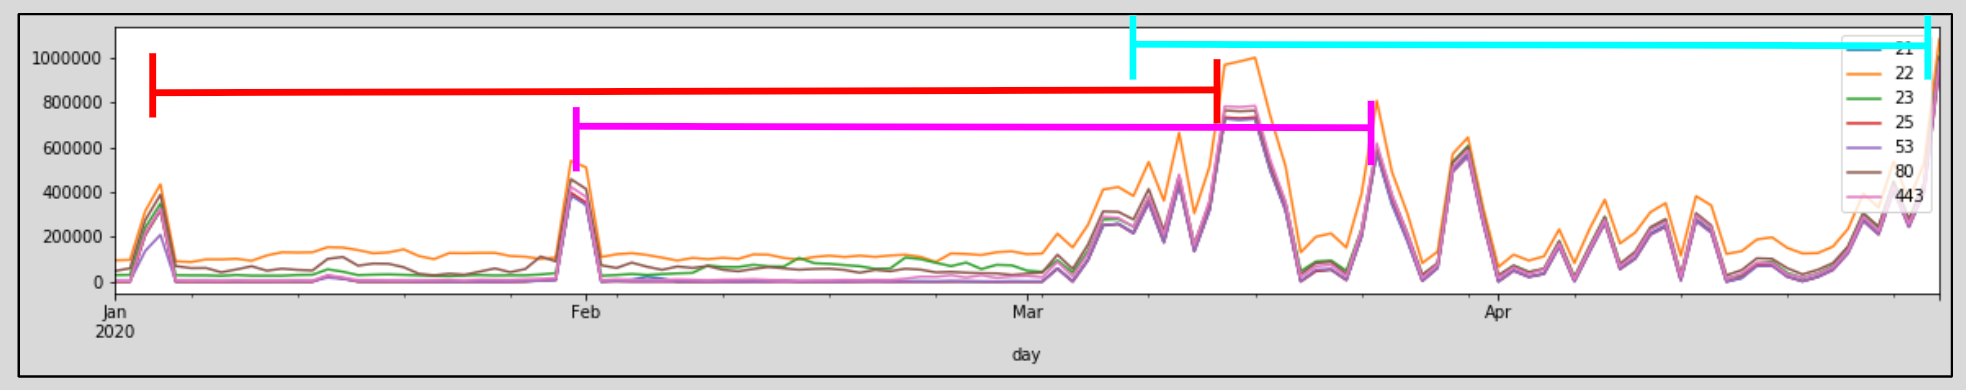
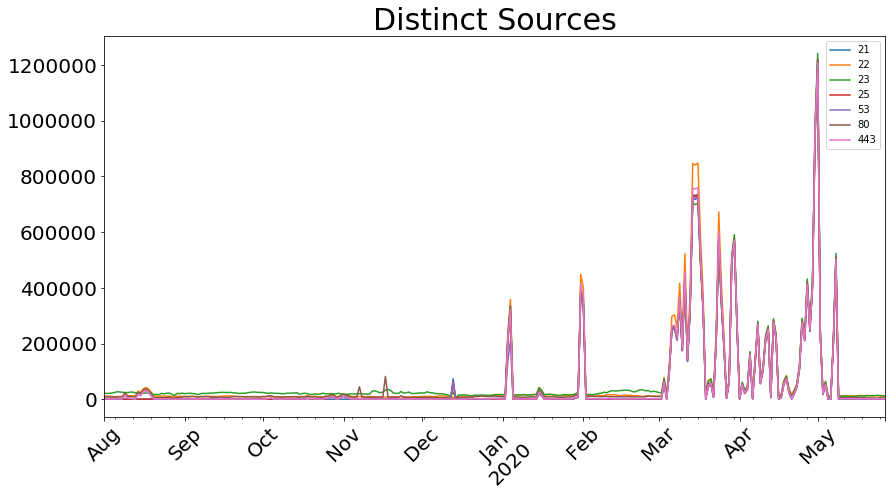
The graph below shows the pattern of activity, namely the sharp spikes and sustained increase in the number of distinct IP addresses seen scanning these ports every day.
We have also seen the same activity against these ports, which later dropped off in April.
- 110 (POP3)
- 123 (NTP)
- 3389 (RDP)
- 5060 (SIP)
- 7547 (TR-069)
- 8080 (HTTP-alt)
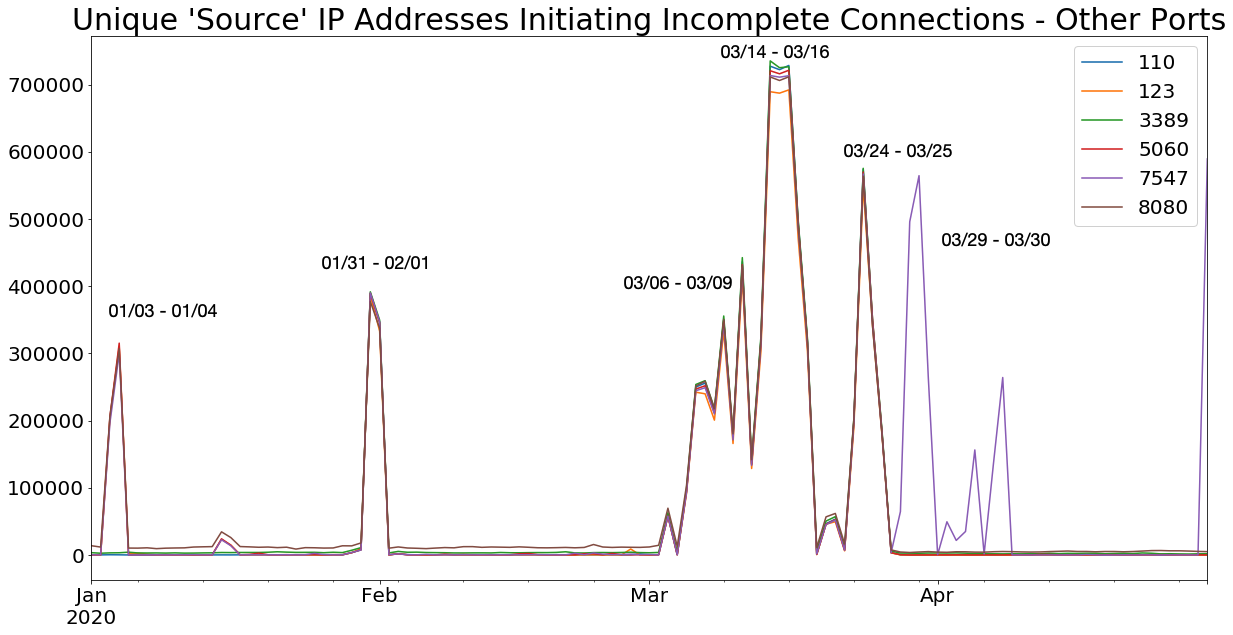
We suspect that other ports have been included on certain days, but they have not been as consistently uniform in their source IP volume. Some of these are ports you might expect, such as 3389 or 1433, but also included less common ports such as 5060, 111, and 17.
It is important to note the sheer numbers here. While honeypot traffic analysis is no stranger to large numbers, the daily scale of unique IPs for this specific traffic is in the hundreds of thousands. The IPs seen are mostly different every one or two days, so it is not even the same million or so source IPs involved the whole time. All told, we estimate that the activity we have seen between January and May 2020 involves more than 100 million unique IP addresses (insert Dr. Evil meme). For comparison, the largest botnets in history are estimated to be in the range of 1 million to 10 million hosts.
This is one of the reasons we believe this activity to be spoofed—not in fact actually coming from these supposed sources. If this activity truly represented nodes under control by a single entity, the sheer number of IP addresses involved would be the largest botnet ever created by several orders of magnitude.
Also of note is that while the total number of connections is similarly staggering and generally follows the same pattern, it does not follow the source IP pattern exactly. Nor is it uniform between ports the same way distinct IPs were. This likely means two things:
- Some spoofed IPs “send” more traffic than others (much more on this later). If each spoofed IP sent the same number of packets, connections would simply be a multiple of the number of distinct IPs.
- Packet numbers are not evenly distributed among ports, even among spoofed IPs. Otherwise, the lines below would be more parallel to one another.
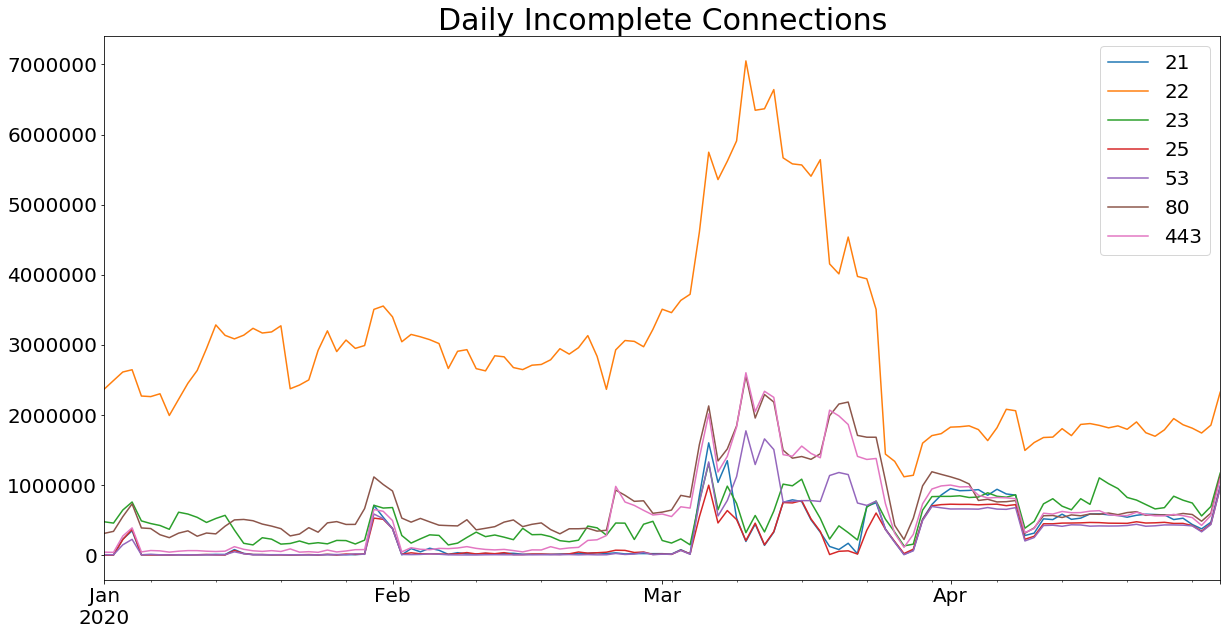
So, in summary, we have a historic number of spoofed “sender” IP addresses sending a historic amount of traffic on common ports. Also of note is that these are all TCP ports, including ports 53 and 123 where UDP would be a more common protocol. The next step was to look at the traffic and see if these connections had anything in common.
What makes this traffic unique?
Furthering our theory of spoofing, in every case we have examined, across multiple ports, these scans never establish a full TCP handshake, typically sending only SYN packets. An example is below, filtered on just the spoofed “source” IP, which we have redacted.
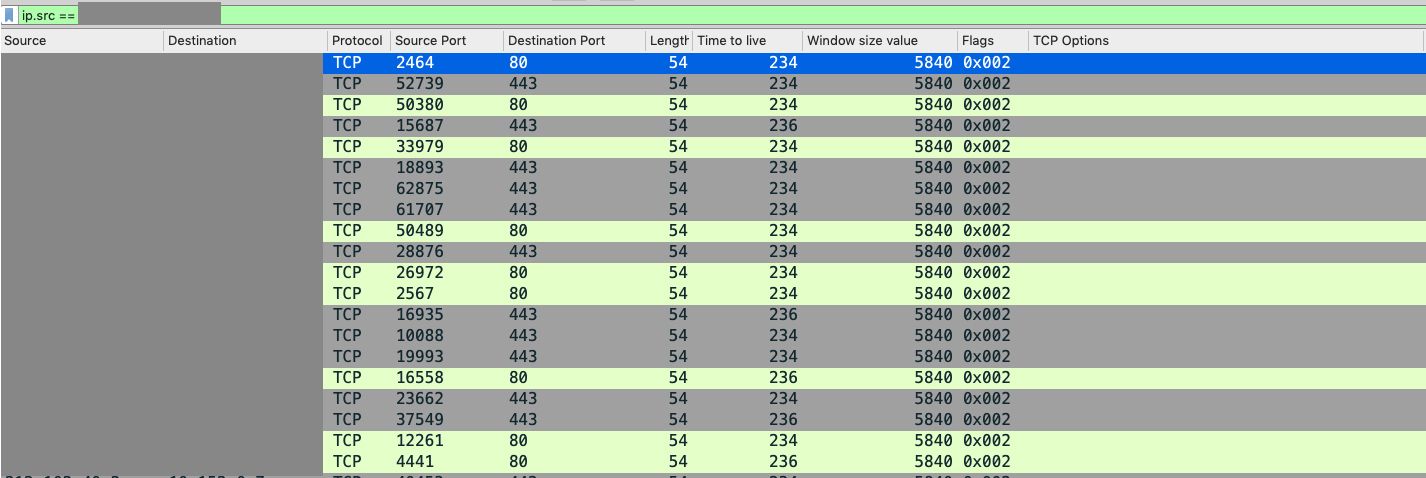
In our dataset, we generally find these connections have the following characteristics:
- Frame Length is always 54.
- TTL values are variable and sometimes do not make much sense. They’re either very low, or very high, and do not seem to fit typical TTL values for normal operating systems. Packets with the exact same source and same destinations, sent milliseconds apart, will very often have varying TTL values.
- Notably, the “TCP Options” field is empty. This is uncharacteristic of normal TCP traffic, and is a strong indicator of synthetic traffic.
- Window size is generally 5840 or 29200.
There are other strange idiosyncrasies with the traffic. For example, SYN packets will often reuse source port numbers, sometimes using non-ethereal source ports like 21 or 22. There are some rare instances where the packets contain SYN and PSH flags, or the RST flag. However, a handshake is never completed. It is, of course, possible that some of these idiosyncrasies are from unrelated activity, but it is difficult to tell, given the scale of the activity, exactly which IPs are involved and which are not. After all, this very confusion may in fact be the purpose of the activity.
Where is this pretending to come from?
Grouping by Country Code (while also realizing the sources were certainly spoofed), we get these results for the top 10 “source” countries:
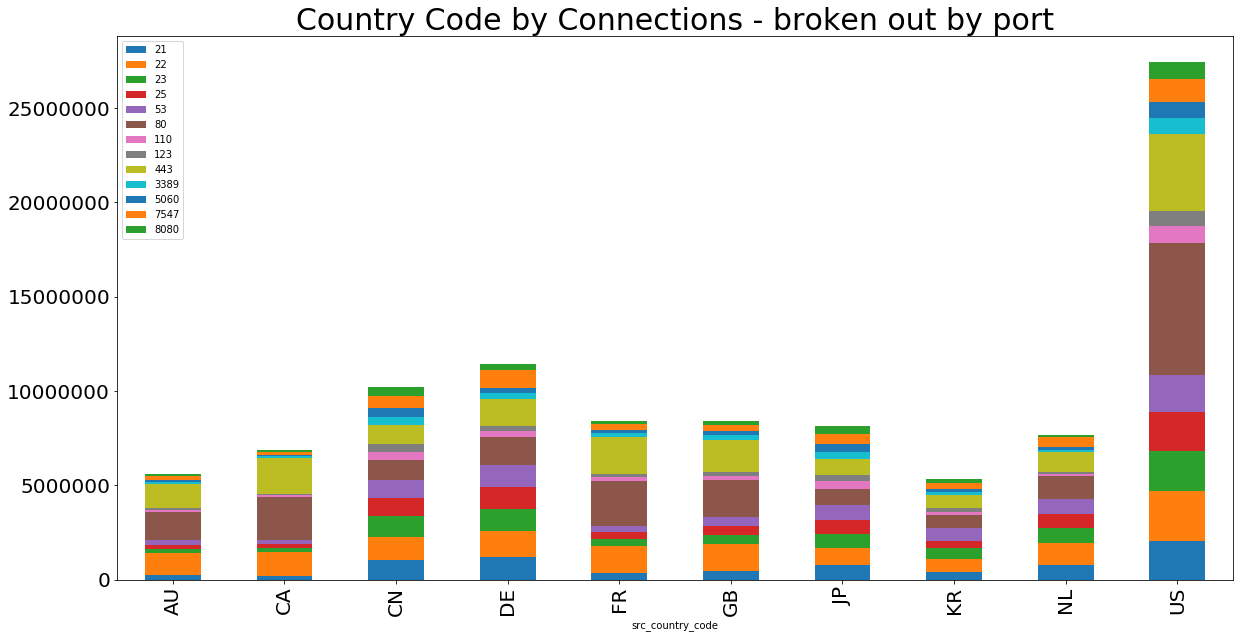
These results are not very surprising, since many of these nations contain large hosting infrastructure and would be expected in most lists of top internet traffic. Perhaps the actors here are simply sampling spoofed IPs from the public internet. If they were, then the distribution of source IPs in this traffic would roughly mirror global IP allocation. However, the distribution of the top 100 source country codes seen in spoofed traffic does not match global IP allocation.
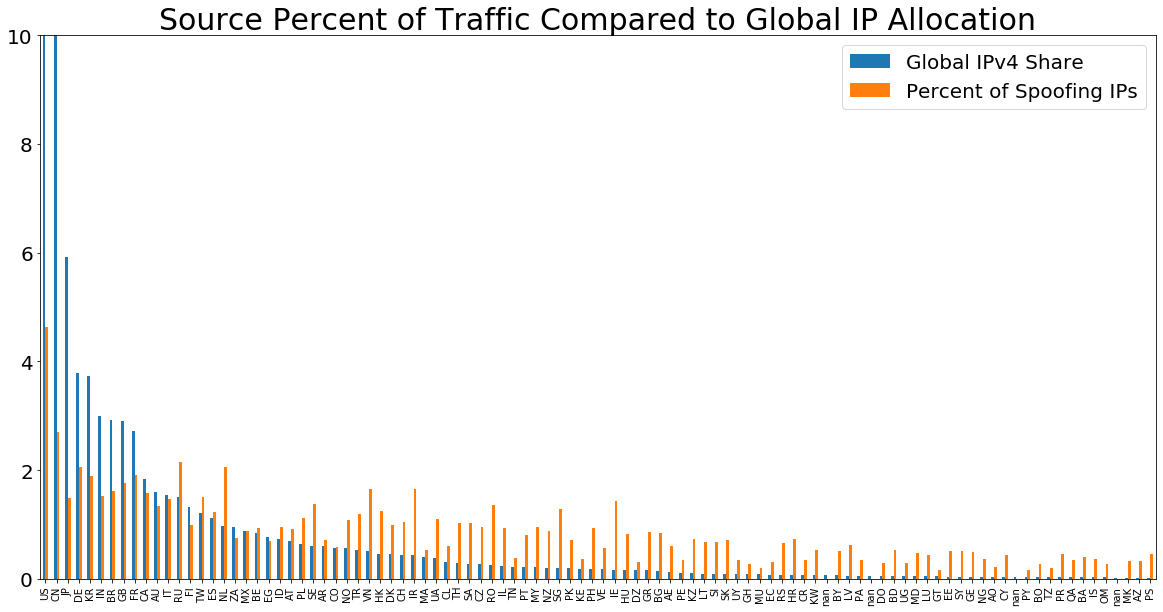
Whereas the Global IPv4 allocation is highly concentrated on the left—the U.S. is allocated roughly 34% (bar was cut off for scale)—the spoofing activity is disproportionately high among “smaller” players. This indicates that the purported “sources” of the spoofed traffic likely do not follow a random selection from IPv4 address allocation—rather, there is something more manual behind which source IPs are used.
“Sender” IP analysis
As mentioned earlier, the number of packets sent varies wildly by source IP. Many source IPs send one and only one packet, while others send hundreds of thousands. Below, we will examine the breakdown of source IPs and various ways we are identifying anomalies.
We pulled every IP address that had appeared hitting our honeypots on these ports, then built features for each IP in the activity. These features included:
- First Seen: First seen from January 2020 until now
- Last Seen: Within the same period
- Duration: Delta in days between First and Last Seen
- Number of Days: The number of distinct days during that time, when the IP appeared as a source of spoofed SYN scans to our honeynet.
- Connections: Total number of connections from the IP to our honeynet over 2020 so far.
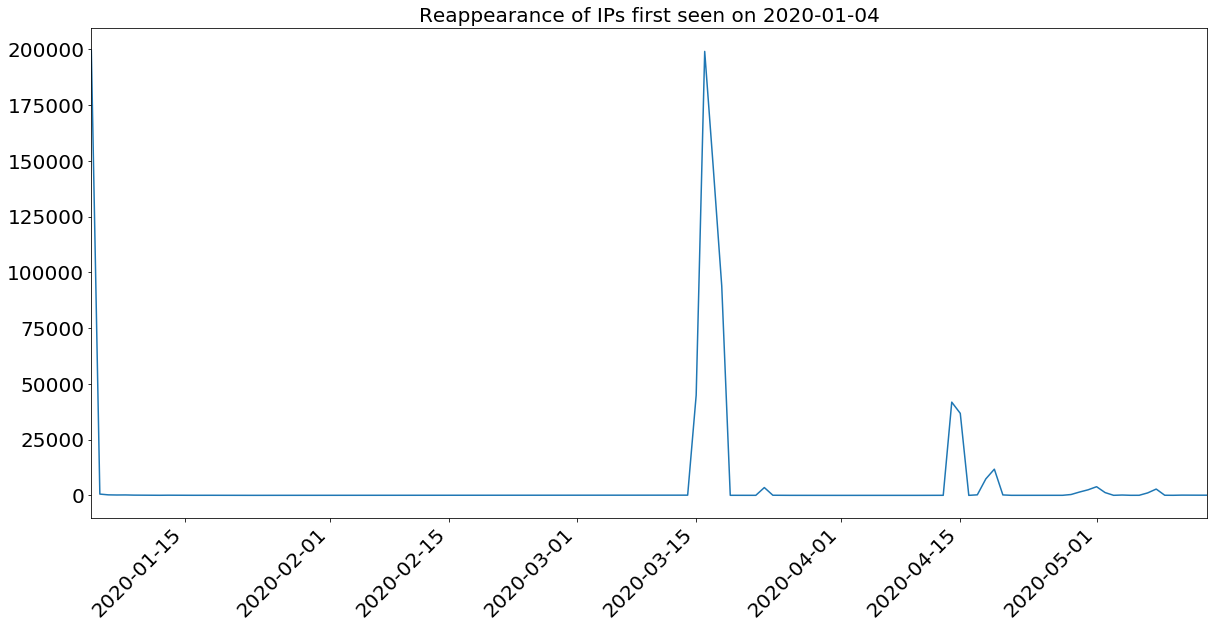
The first thing we wanted to look for was an idea of turnover.
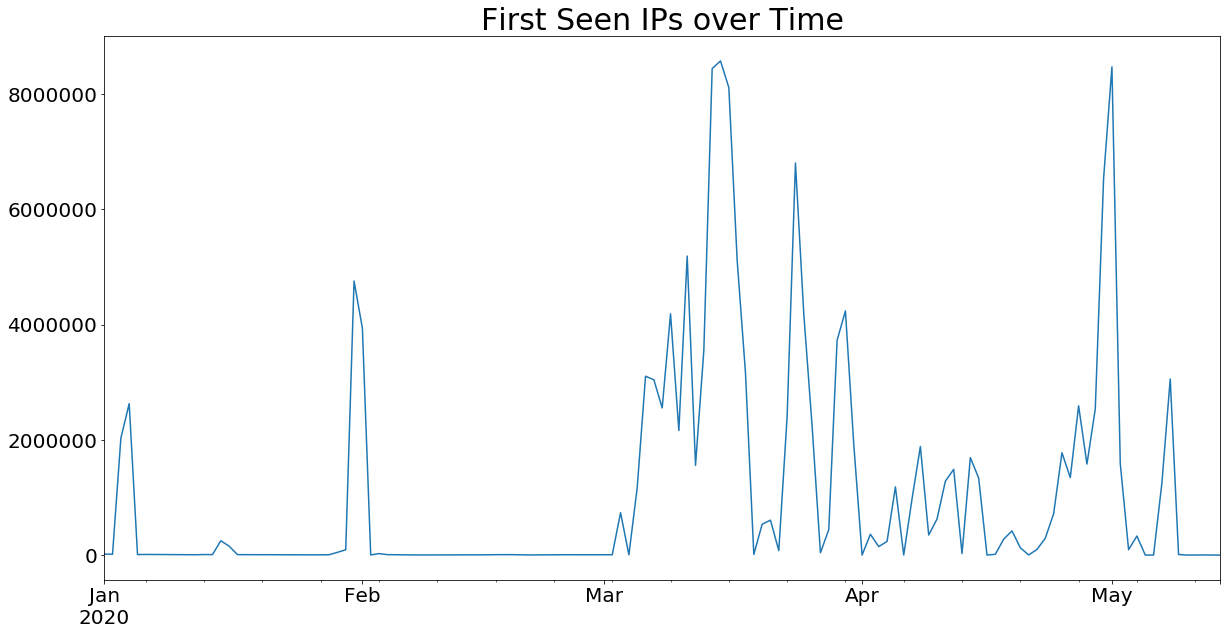
The above graph shows the timing of when IPs first appear in the traffic. As you can see, much of the traffic on any given day is performed by IPs participating for the first time.
Additionally, we can look at the total number of days that an IP is used in this activity.
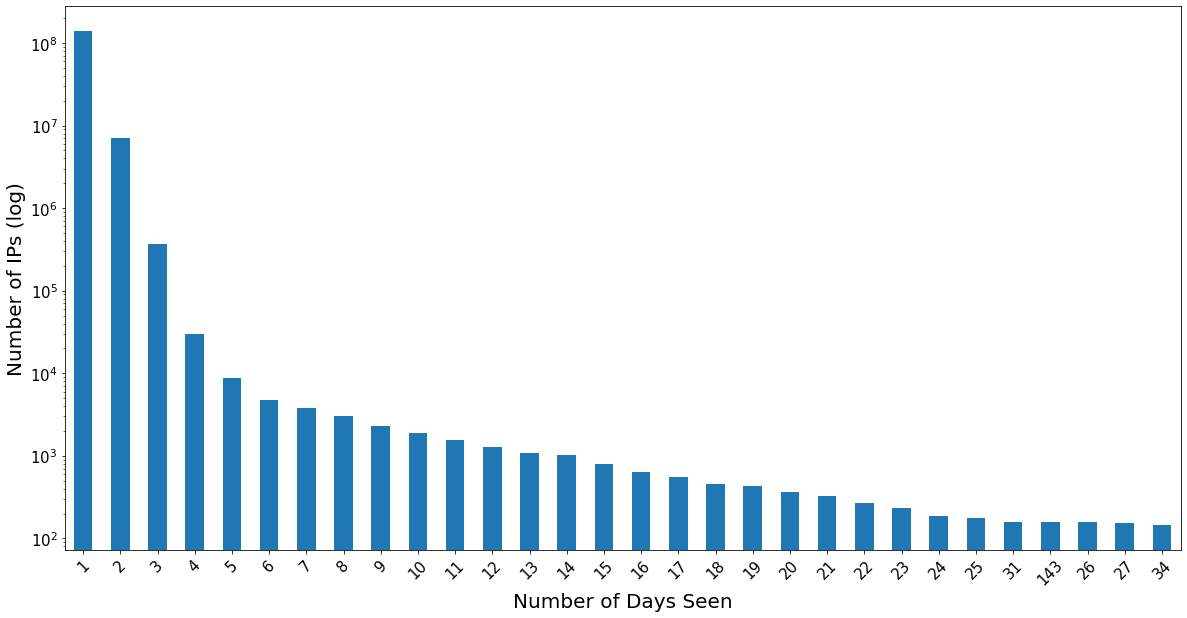
Note that the y axis is on a log scale, so the vast majority of spoofed source IPs appear only one or two days total. Let’s also look at the Duration—the total days elapsed between First Seen and Last Seen:
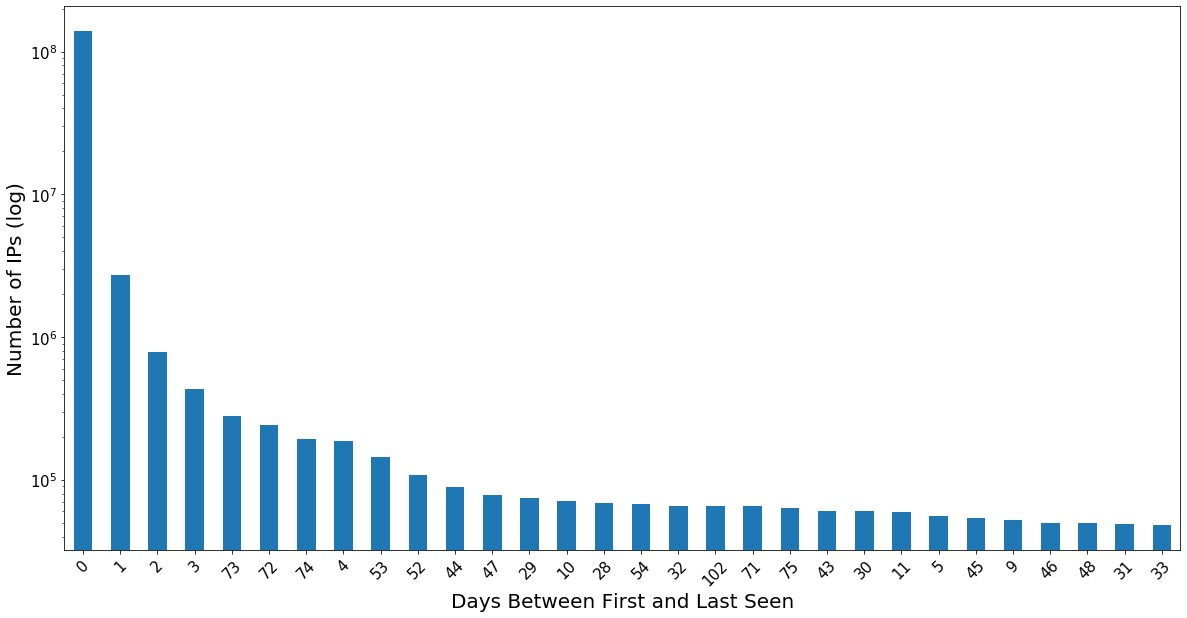
As you can see, not surprisingly, the vast majority of IPs are only seen for one day, with a net duration of zero.
However, it is interesting that there are still a fair number of IPs in the long tails here—those that appear on multiple days, or whose appearances are many days apart, or both.
You may have also noticed an interesting anomaly in the decreasing durations:
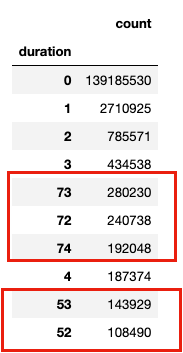
Where we would expect the “day interval” to simply count up from 0 (only appeared one day) to 1,2,3, etc., we see this cluster of IPs for which the Duration is between 72–74 days. Further down, we see a grouping of 52 and 53 day intervals. When do these IPs first appear and last appear?
Once we filtered on that data, we got consistent appearance of a couple very specific dates:
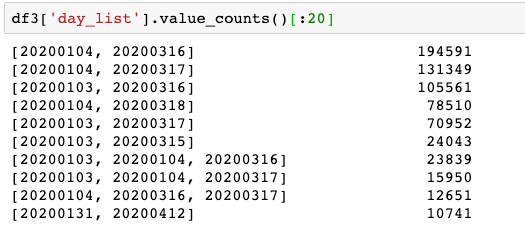
This indicates a very specific interval of appearance for the IPs seen on Jan. 3 and Jan. 4. Even though there is another spike of activity at the end of January, we do not see those IPs then. In fact we don’t see them again until until March 15.
Repeating this analysis a couple of times gives us a few intervals of reappearance:
Jan. 3, 4 → March 15,16,17
Jan 3,4 → April 14, 15
Jan. 31, Feb. 1 → March 24 and 25
March 15,16,17 → April 30 to May 2nd
This further indicates manual operation of some extent—this activity is neither purely random nor evenly distributed. While we cannot prove intent or motivation for these intervals, they are not the same length, nor do they involve the same number of addresses each time. There is some reuse for each large spike, with decreasing overlaps over time. This likely indicates some degree of human tinkering on the back end.
The signal and the noise
Finally, while most of the activity involves IP addresses used for one or two days, there are a small minority of IPs issuing huge numbers of requests, and appear on many days—but, importantly, not all days. It is possible that these IPs serve a specific purpose or that the traffic they send is in some ways different in nature than the rest of the traffic.
For this analysis, we focused only on traffic sent to TCP port 25 (typically used for SMTP), which resulted in the ‘S1’ conn_state, and took place between (and including) the months of January and May 2020. Focusing on a single port removed noise and reduced the dataset to something that could more easily be examined and iterated on. The same analysis should be done for other common ports seen in this traffic.
For every IP address in the data, we built a profile, including first seen, last seen, number of days total, the ‘duration’ between the first and last date, and other stats like ‘day density’ (the fraction of the duration taken by days seen). For example, an IP seen on only two days, but those days are a month apart, would have a much lower ‘density’ than an IP seen on two consecutive days.
Here is the breakdown by duration and number of days:
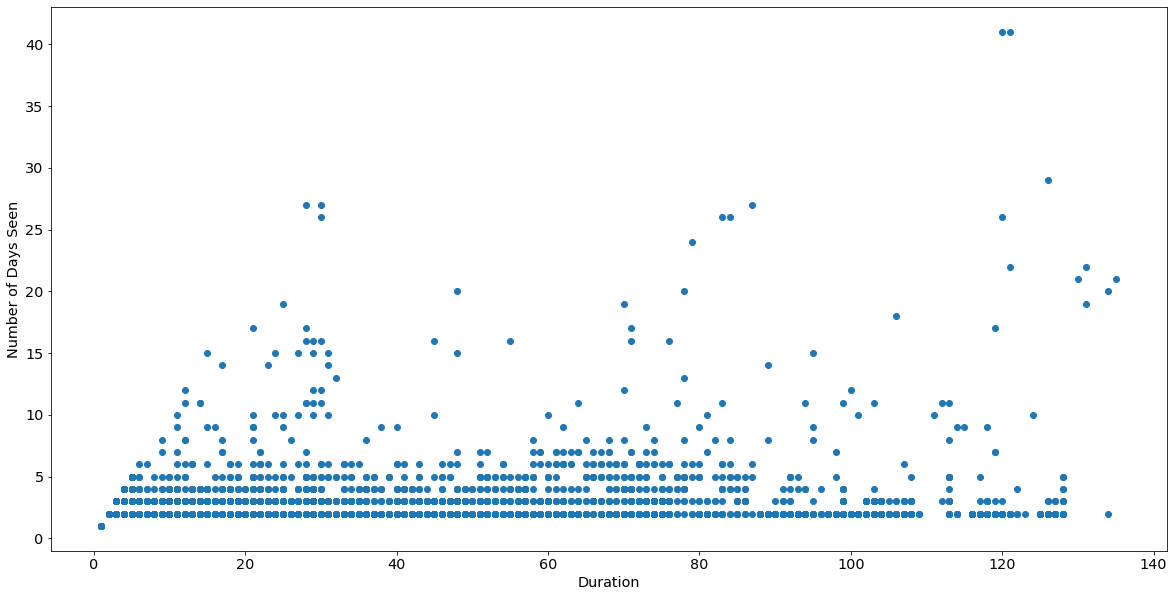
As you can see, the vast majority of IPs exist near the bottom, each a small number (1–2) of days total. However, some of the IPs with 2–5 days have long durations—that is, the few days they appear are very spread out. Lastly, there are very few IPs with a large number of days total, over a long period of time. Let’s factor in total number of connections as well (apologies for my 3D graphing skills, I’m no @hrbrmstr):
Here, we can definitely spot one outlying spoofed source IP, the red dot near the top.
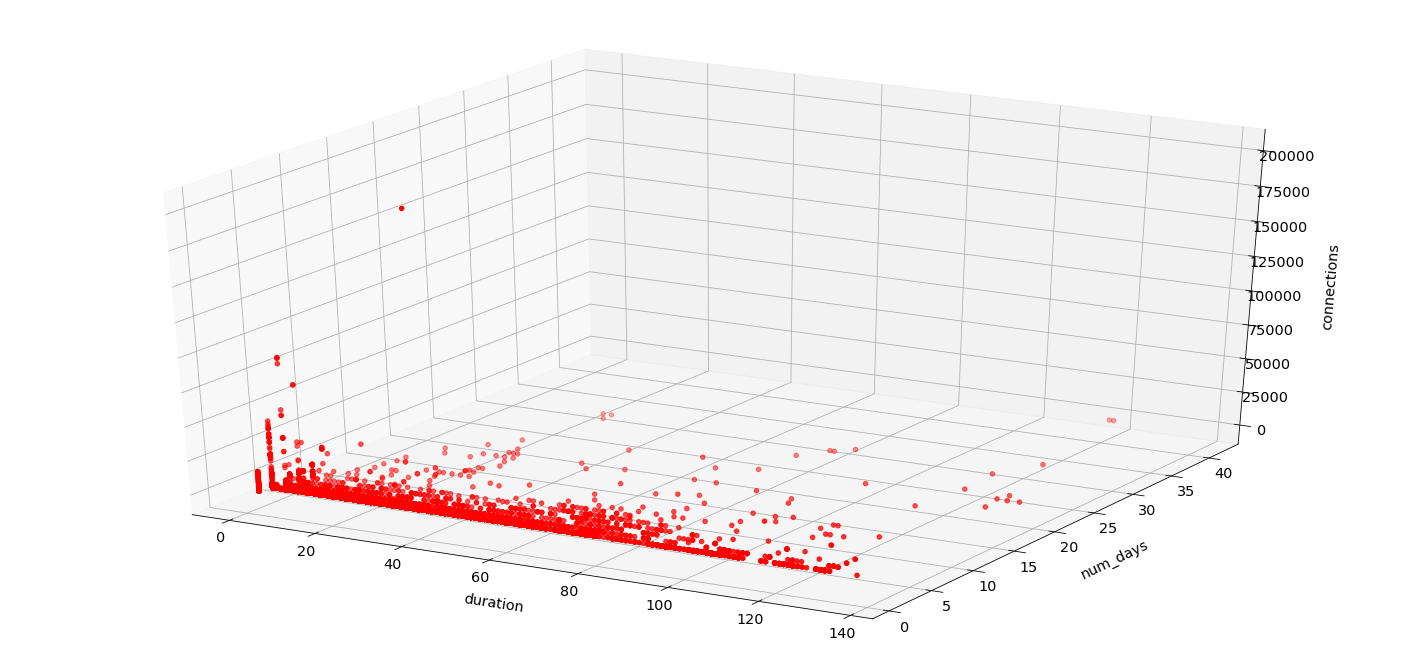
Using this approach, we are building shorter lists of interesting IP addresses to perform deeper analysis to find differences in the content. While we have been able to spot these anomalies, thus far, traffic from these “top talkers” has not substantially differed from the other packet profiles noted above. It is of course possible that the anomalies we see are strange artifacts of routing, misconfiguration, or some other factor unrelated to intent.
So what? Speculation and wildly unfounded theories
Frustratingly, we cannot point to an existing threat that we can say with any likelihood is responsible for this activity. Additionally, given our available evidence, this does not appear to currently pose a threat to organizations. Most organizations with basic network security will simply block this type of traffic. Furthermore, the traffic is not concentrated enough on any single destination to be considered a large-scale DoS attack. So, why is it happening? Here, we can only offer speculative theories. Caution: these theories can provide new investigative directions, but in the end, only consistent evidence matters.
Cover for collection
Given the likely spoofed nature of the traffic, the originating party would only receive response data if they were in a position to collect the responses. Therefore, an actor would need to have some other listening capability to collect this spoofed traffic for scanning information. It is possible that some of the traffic is not spoofed and could hide in the noise, such that the actor would receive the responses from traffic sent by their actual infrastructure. So, either the actor has the ability to intercept responses, or this traffic could be providing a cover for actual scanning activity. However, this theory has holes. While May 2020 does seem an auspicious time to gain information about rapidly changing internet exposure, many other data sources already exist that could provide this information. Furthermore, why draw attention to SYN scanning by doing so much of it?
Poisoning threat intel
It is possible that this could be an effort to “poison” automated threat intel feeds by suddenly inundating them with millions of IP addresses purportedly performing scanning. In investigating some of these spoofed sources, we have seen them appear on recently updated blacklists and threat intel feeds. This is possible, but the scale of the activity is large enough to be unnecessary for this goal.
Testing
Much of what we have outlined above looks like potential testing. An initial spike occurs in January, followed by a lull in activity and then another “test” at the end of January. Later, sustained traffic occurs, with small tweaks appearing here and there. An actor with interest in deploying TCP spoofing for more destructive purposes could simply be testing their capability. The broad spread of distinct spoofed IPs does not create denial-of-service (DoS) conditions now, but that could change. It is possible that this is someone testing or demonstrating capability.
Recent activity and next steps
On April 30, May 1, and May 2 2020, we saw the highest levels of connections from this activity, followed by a sharp drop-off. Activity spiked again around May 8, but it has disappeared since then. Now that we have some rough signatures for what the traffic looks like, we are able to detect these spikes as they occur. Additionally, while it is impossible to confirm, we have seen some traffic which looks similar to this dating as far back as 2017, though not nearly at the levels seen this year.
Finally, a caveat: Our visibility is by definition limited to our honeypots. While other organizations have corroborated these trends, we do not have a large amount of details on traffic being sent elsewhere.
The above theories are illustrative of what might be the intention here, but we do not currently have solid evidence to support a most probable theory, or eliminate others. Additionally, at the time of writing, we have no evidence to confirm that this presents an exigent threat. The simple fact is we do not know why this is happening, only that we are seeing it, it is new and strange, and other organizations have corroborated these trends. Given the unprecedented scope and volume, we felt it was worth publishing our research to begin a discussion among researchers, and hopefully understand this better.
Many thanks to Andrew Morris of GreyNoise and others in the community for providing information and feedback on this research.