Last updated at Wed, 24 Jan 2024 22:05:09 GMT
We all know jolly ol’ St. Nick just loves lists, which is an attribute he shares with the researcher elves here at Rapid7 Labs. Unlike Sir Kringle, our lists aren’t focused on normalizing the inevitability of a pervasive surveillance state nor intended to establish the acceptance of—and participation in—a global social credit system, but have more to do with cataloging (mostly) naughty aspects of internet infrastructure and activity through our core research platforms, Projects Sonar and Lorelei.
The Labs team thought it might be fun to give folks a glimpse into who made it to some of our naughtiest lists in 2019 with a “year in review” look at insights gleaned from both our research projects.
The top 20 ‘naughtiest’ countries
There are many ways to track attacker activity, one of which is to look at which source country IPv4 assigned network blocks that traffic comes from. This doesn’t mean that said nation state is performing the attacking, just that poorly secured devices or servers and/or deliberate attacker infrastructure just happen to be found sitting on addresses in a country’s IPv4 blocks.
Our first two lists came from making distributions of the total and unique (by source IPv4 address) connections from each country. We plotted a dot for the counts for each day, for the entire year, which produced these ornament-like views of who led the top of the naughty charts for overall activity:
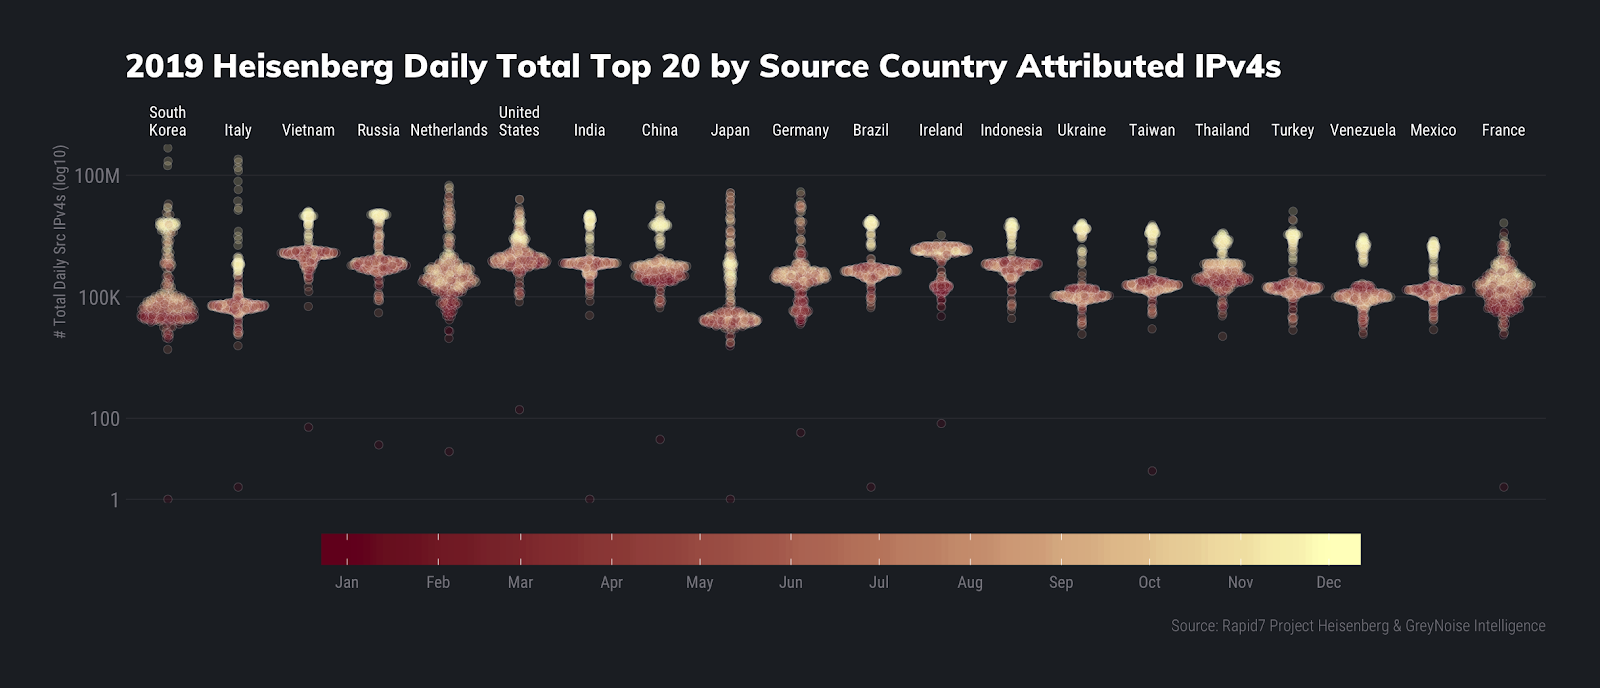
Daily Total Count Summaries
| Country | Mean | Median | Max |
|---|---|---|---|
| South Korea | 3,767,280 | 63,062 | 474,401,326 |
| Italy | 2,893,137 | 60,906 | 250,177,457 |
| Vietnam | 2,059,689 | 1,152,240 | 13,059,591 |
| Russia | 1,912,321 | 647,866 | 11,929,010 |
| Netherlands | 1,908,403 | 293,010 | 56,580,766 |
| United States | 1,766,281 | 877,332 | 25,671,173 |
| India | 1,533,114 | 662,440 | 11,326,275 |
| China | 1,371,649 | 447,379 | 18,696,263 |
| Japan | 1,223,301 | 29,438 | 37,018,858 |
| Germany | 1,194,439 | 307,203 | 39,021,995 |
| Brazil | 1,133,831 | 430,058 | 8,508,665 |
| Ireland | 1,116,873 | 1,366,478 | 3,312,785 |
| Indonesia | 1,116,656 | 607,546 | 7,276,011 |
| Ukraine | 746,586 | 111,519 | 6,751,413 |
| Taiwan | 672,776 | 194,780 | 5,970,135 |
| Thailand | 623,691 | 347,953 | 3,813,670 |
| Turkey | 622,893 | 170,438 | 12,959,915 |
| Venezuela | 344,164 | 108,715 | 3,039,704 |
| Mexico | 324,235 | 144,312 | 2,431,246 |
| France | 312,848 | 173,254 | 6,646,730 |
Italy usually isn’t in the overall top 20 by total volume, nor has it ever been in the No. 2 position for the year in our four-year history of running our Lorelei honeypot network. We’ll talk about just what IPv4s in Italy (and the Netherlands, since they are making an unusual Top 5 appearance as well) were doing to achieve this top spot in an upcoming report, along with what’s going on with some of those huge max count numbers..
South Korea and Vietnam both have scads of horribly configured Internet of Things (IoT) devices, which make them ideal sources of botnet and other attacker activity. Russia and China are, well, Russia and China, and both the U.S. and India are hotbeds of similarly horribly configured physical and virtual hosts.
We continue our Christmas ornament distribution plots with a similar look at unique source IPv4 addresses from each country:
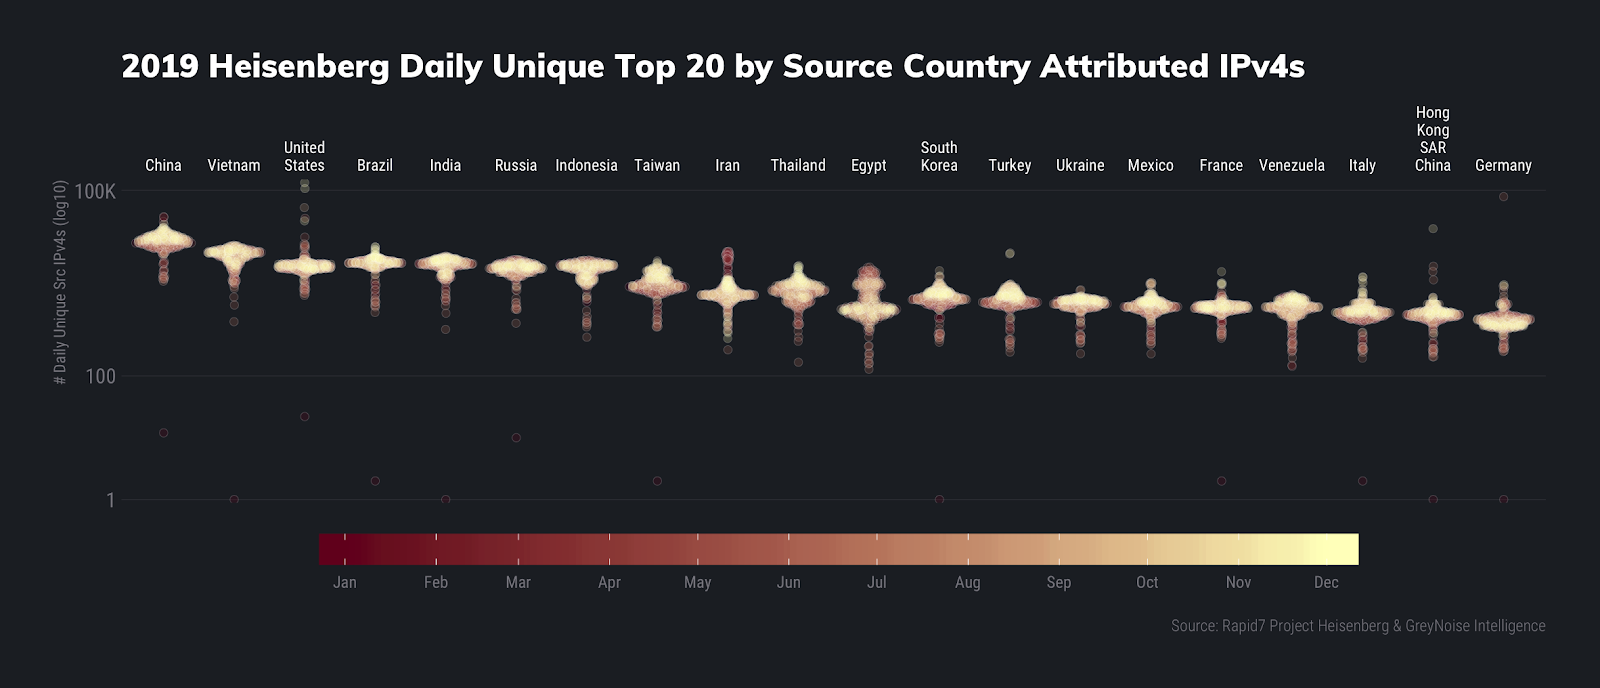
Daily Unique Count Summaries
| Country | Mean | Median | Max |
|---|---|---|---|
| China | 15,152 | 14,961 | 37,250 |
| Vietnam | 8,666 | 9,270 | 13,015 |
| United States | 6,902 | 5,841 | 133,100 |
| Brazil | 6,647 | 6,742 | 12,275 |
| India | 6,076 | 6,423 | 8,672 |
| Russia | 5,438 | 5,504 | 7,623 |
| Indonesia | 5,221 | 5,652 | 7,508 |
| Taiwan | 3,224 | 2,942 | 7,218 |
| Iran | 2,641 | 2,064 | 10,350 |
| Thailand | 2,377 | 2,369 | 6,090 |
| Egypt | 1,926 | 1,314 | 5,718 |
| South Korea | 1,845 | 1,773 | 5,029 |
| Turkey | 1,781 | 1,638 | 9,688 |
| Ukraine | 1,455 | 1,478 | 2,458 |
| Mexico | 1,362 | 1,325 | 3,245 |
| France | 1,291 | 1,272 | 4,842 |
| Venezuela | 1,266 | 1,282 | 2,067 |
| Italy | 1,085 | 1,034 | 3,989 |
| Hong Kong SAR China | 1,077 | 974 | 23,988 |
| Germany | 1,049 | 772 | 79,167 |
It’s amazing that so few nodes can generate such high volumes of activity, yet we still have no single authority that can do much of anything about it.
The most common unique vs. total activity usually hits a sweet spot of around 100 nodes to 10,000 connections across our fleet of ~250 honeypots (points are colored by date similar to the previous charts, with recent activity in dark orange; the density layer shows the most concentrated hot spots of port/pair counts with fitted GAM curve on top):
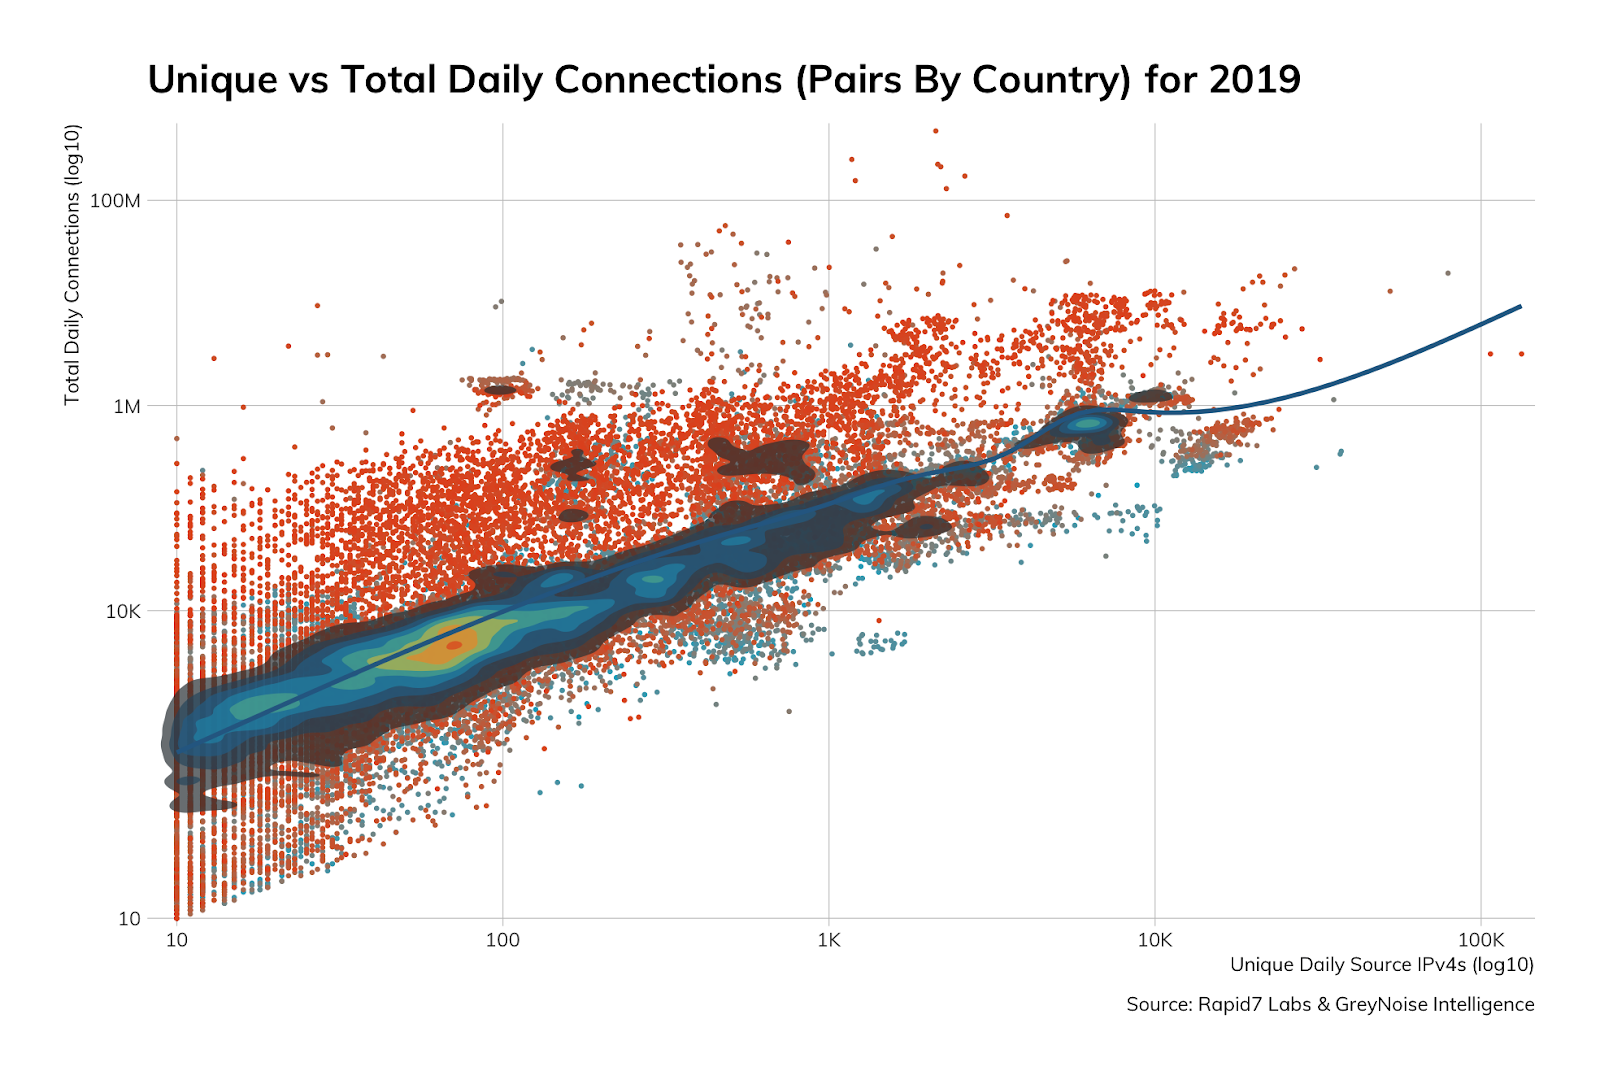
(This also happens to be the exact path Kris Kringle takes across the Milky Way in his sleigh.)
But just what were these sources going after? For that, we need to take a look at another list.
The usual [naughty] suspects
Anyone who has ever run even a single honeypot knows there are a handful of ports, protocols, and services that most opportunistic attackers seem to gravitate toward. Whether it be brute forcing/credential stuffing SSH, Telnet, or RDP, holding compromised SMB territory with EternalBlue attacks, or trying to slurp up records from MySQL, Postgres, MS SQL and other databases, opportunistic attackers are just that: opportunistic and always on the lookout for new, pwnable quarry. We call these ports+protocol+service the “usual suspects,” and the members of this year’s suspects list of most naughty activity looks a bit different than 2018.
We’ll first return to our ornament distribution plots to look at this year’s top 20 usual suspects by daily unique sources and daily total connections:
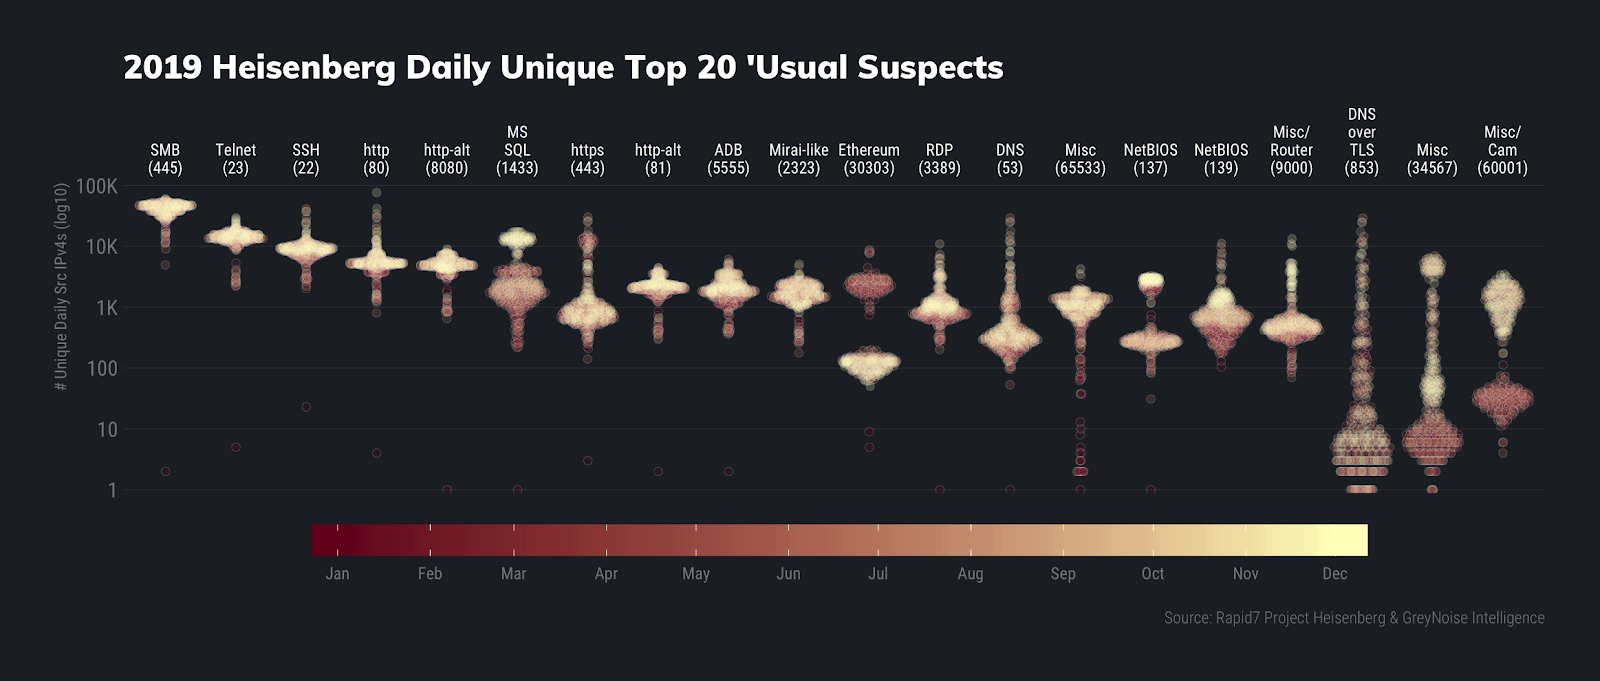
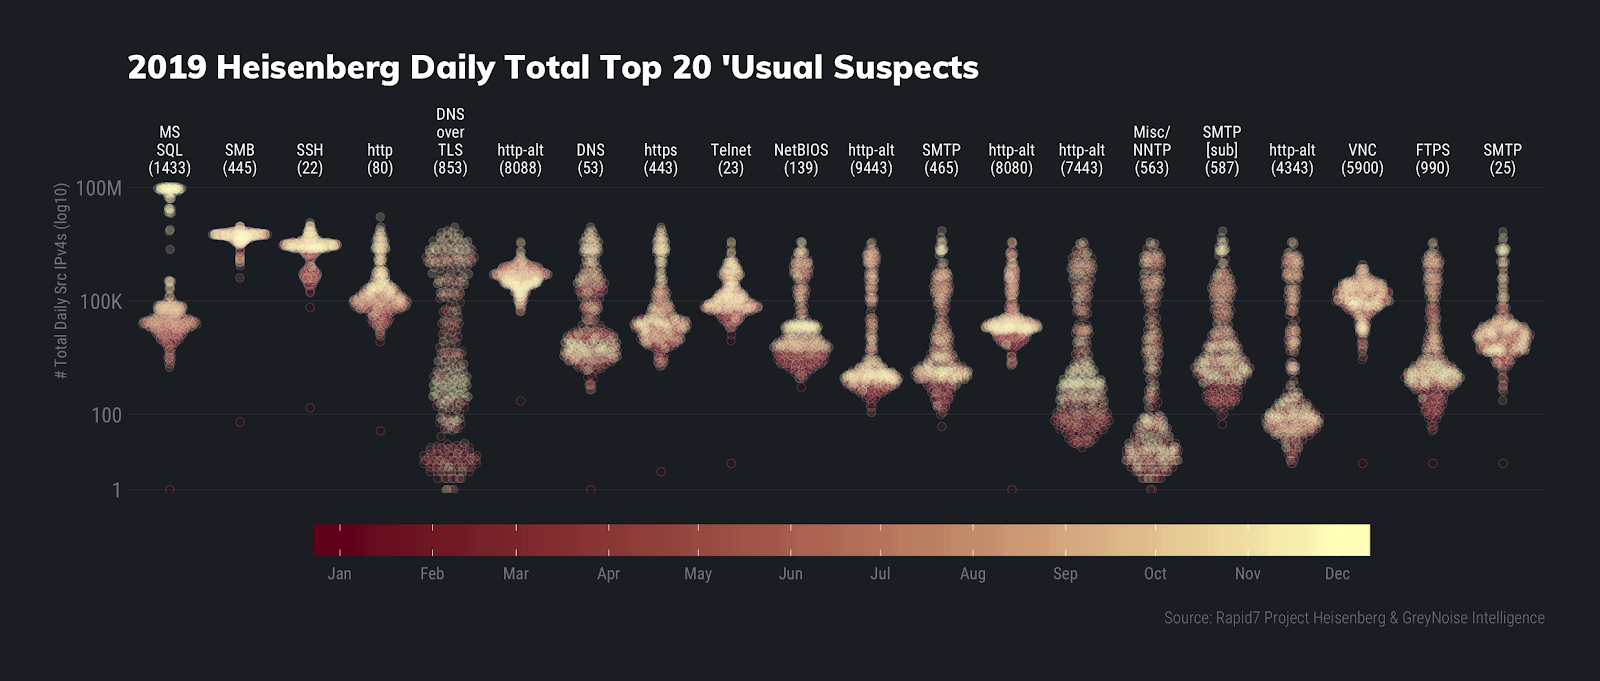
A few items stand out on these charts.
First, we see DNS over TLS activity making it into both top 20 usual suspects lists for the first time ever. In fact, it slid into the Top 5 by total counts due to a series of campaigns starting around midyear. We talked a bit about this in our 2019 Q3 Threat Report and will be taking a deeper dive in our 2019 Q4 and year-end round up threat report (remember, patience is a virtue and helps keep you on Santa’s “nice” list).
Next, we note that when we cycled our honeypot nodes throughout the year, we were assigned IP addresses that used to be part of the Ethereum network, but also caught some interesting activity there, which we’ll likely expand on in the aforementioned forthcoming threat report.
The star of the show, however, is MS SQL Server compromise activity that began in October right after stories about a possible backdoor emerged. While we regularly see credential stuffing/brute forcing (and other activity) against our MS SQL Server honeypots, the October surprise ended up becoming the “new normal” for MS SQL Server activity as seen here in this non-log10-scaled chart:
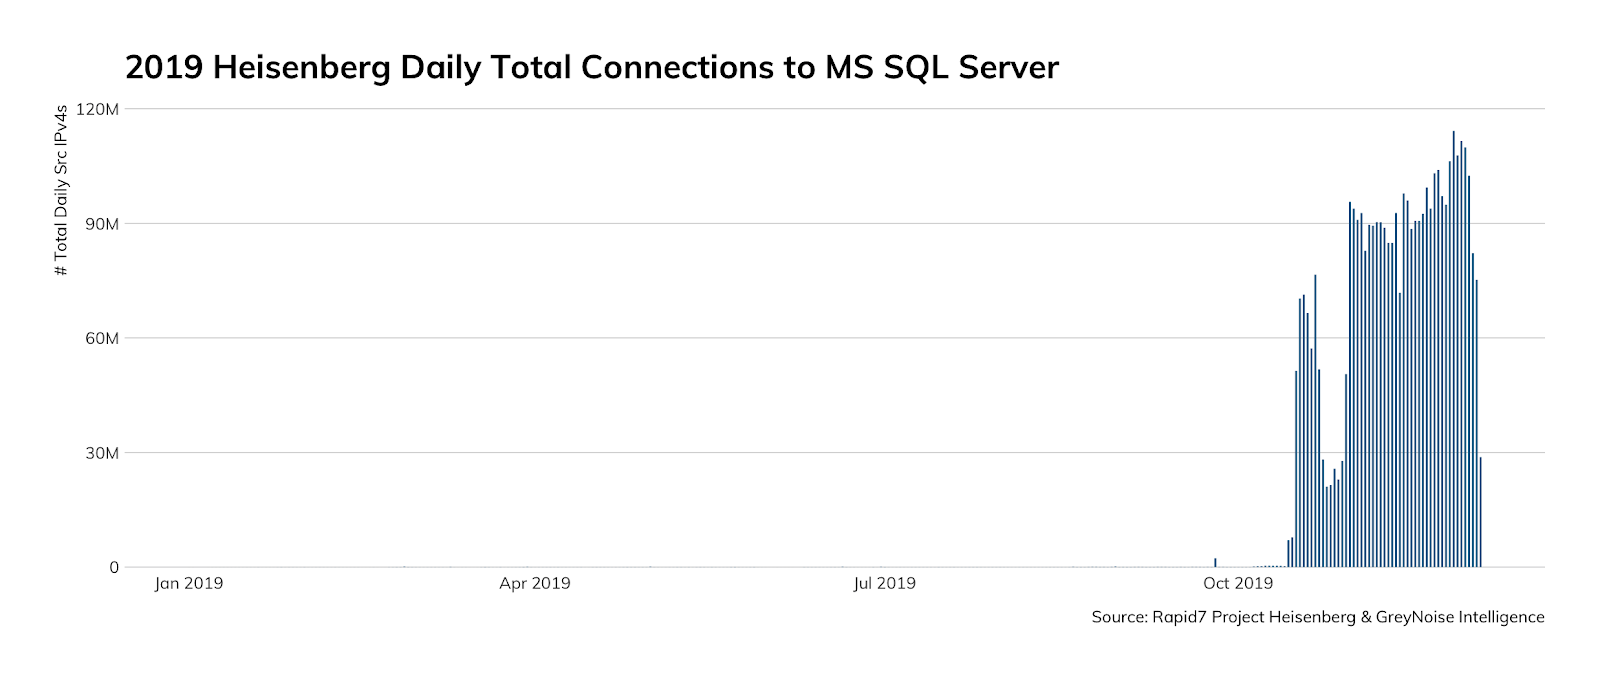
If you’re wondering if there’s anything wrong with your eyes, fear not. You’re definitely seeing several orders of magnitude of increased activity that quite literally dwarfed all previous activity (even if you sum up all of the activity the previous year!).
Now, let’s turn to Project Sonar to see who is putting naughty things on the internet.
Naughty ports/protocols/services
Microsoft SMB
While we, thankfully, continue to see a slow but steady drop in counts of hosts exposing SMB to the internet (due, in part, to more ISPs blocking inbound 139 and 445 connections) there are still quite a few of them out there:
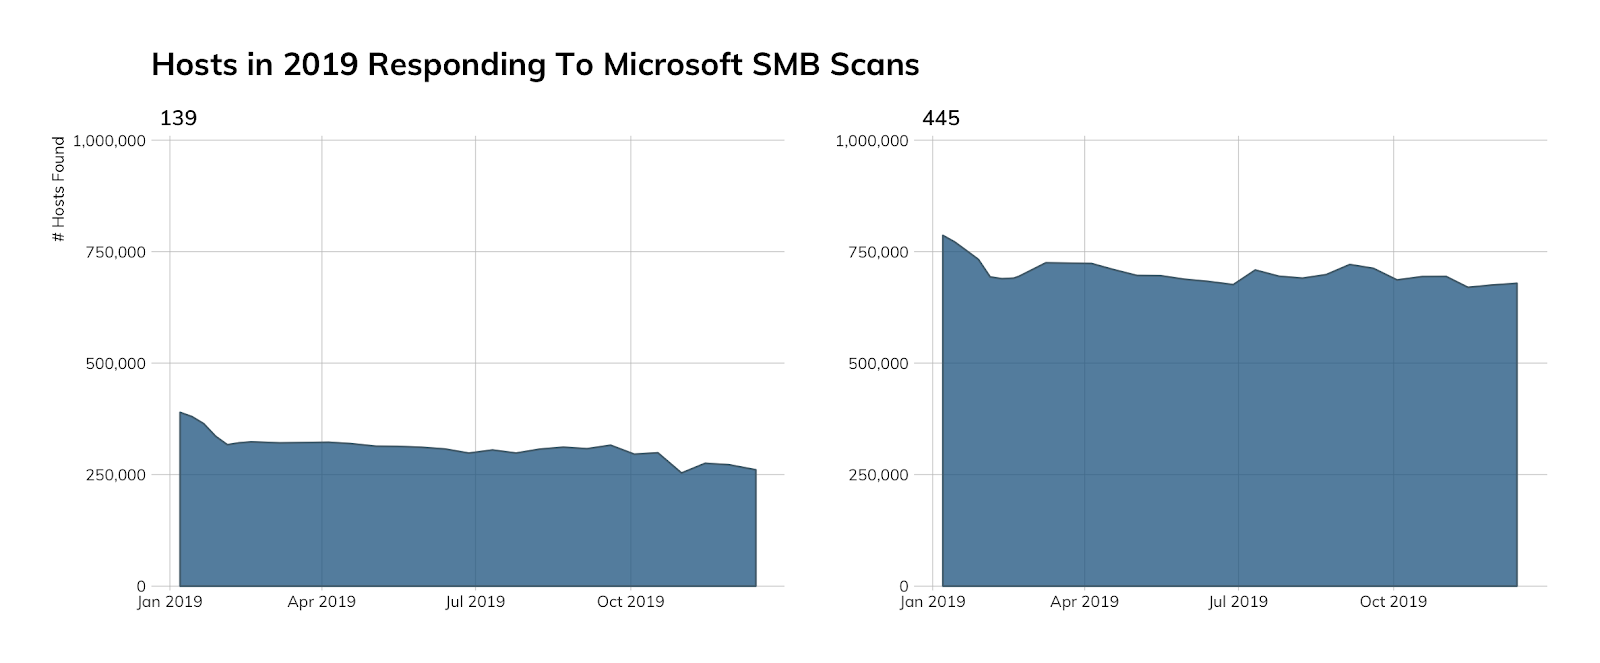
Just looking at port SMB port 445 hosts, the U.S. is still doing its best to make SMB great again and continues to hold its place at the top of the charts:
SMB Port 445 Host Counts by Country • Dec. 13, 2019 Study
| Country | # SMB Hosts |
|---|---|
| United States | 255,485 |
| Russia | 92,862 |
| Germany | 31,376 |
| Hong Kong | 28,838 |
| Japan | 27,445 |
| Taiwan | 23,724 |
| Brazil | 14,544 |
| United Kingdom | 11,724 |
| France | 10,398 |
| India | 9,749 |
| Canada | 9,455 |
| China | 8,741 |
| United Arab Emirates | 8,149 |
| South Africa | 7,903 |
| Netherlands | 7,197 |
| Italy | 6,957 |
| Turkey | 6,109 |
| Mexico | 5,489 |
| Poland | 5,381 |
| Singapore | 4,691 |
| Spain | 4,531 |
| Ukraine | 4,366 |
| Finland | 4,191 |
| Argentina | 4,171 |
| Australia | 3,978 |
There’s no legitimate reason to run SMB on the internet in 2019 (or beyond), and these servers do not just sprout up and host themselves. They live somewhere, and while most are spread across a vast array of autonomous systems, there are some network/hosting providers that house between 1% and 10% of these naughty servers:
SMB Port 445 Hosting Organizations/Networks • Dec. 13, 2019 Study
| Hosting Org | # SMB Hosts | % |
|---|---|---|
| Rostelecom | 73,073 | 10.76% |
| EGIHosting | 53,258 | 7.85% |
| CNSERVERS LLC | 40,211 | 5.92% |
| PEG TECH INC | 35,982 | 5.30% |
| Eonix Corporation | 18,084 | 2.66% |
| Data Communication Business Group | 17,317 | 2.55% |
| ICIDC NETWORK | 15,016 | 2.21% |
| Enzu Inc | 10,351 | 1.52% |
| QuickPacket, LLC | 10,160 | 1.50% |
| DediPath | 9,731 | 1.43% |
| Input Output Flood LLC | 9,419 | 1.39% |
| Tencent Building, Kejizhongyi Avenue | 9,184 | 1.35% |
| NTT Communications Corporation | 8,508 | 1.25% |
| Emirates Telecommunications Corporation | 8,054 | 1.19% |
| MULTACOM CORPORATION | 7,401 | 1.09% |
| Hetzner Online GmbH | 6,876 | 1.01% |
Telnet (Port 23)
The last naughty port/service/protocol we’ll look at is SMB’s older sibling: Telnet. There are far more secure and robust protocols to use than Telnet to talk to servers or devices over the internet, yet we still see just over 3 million of these nodes in each scan:
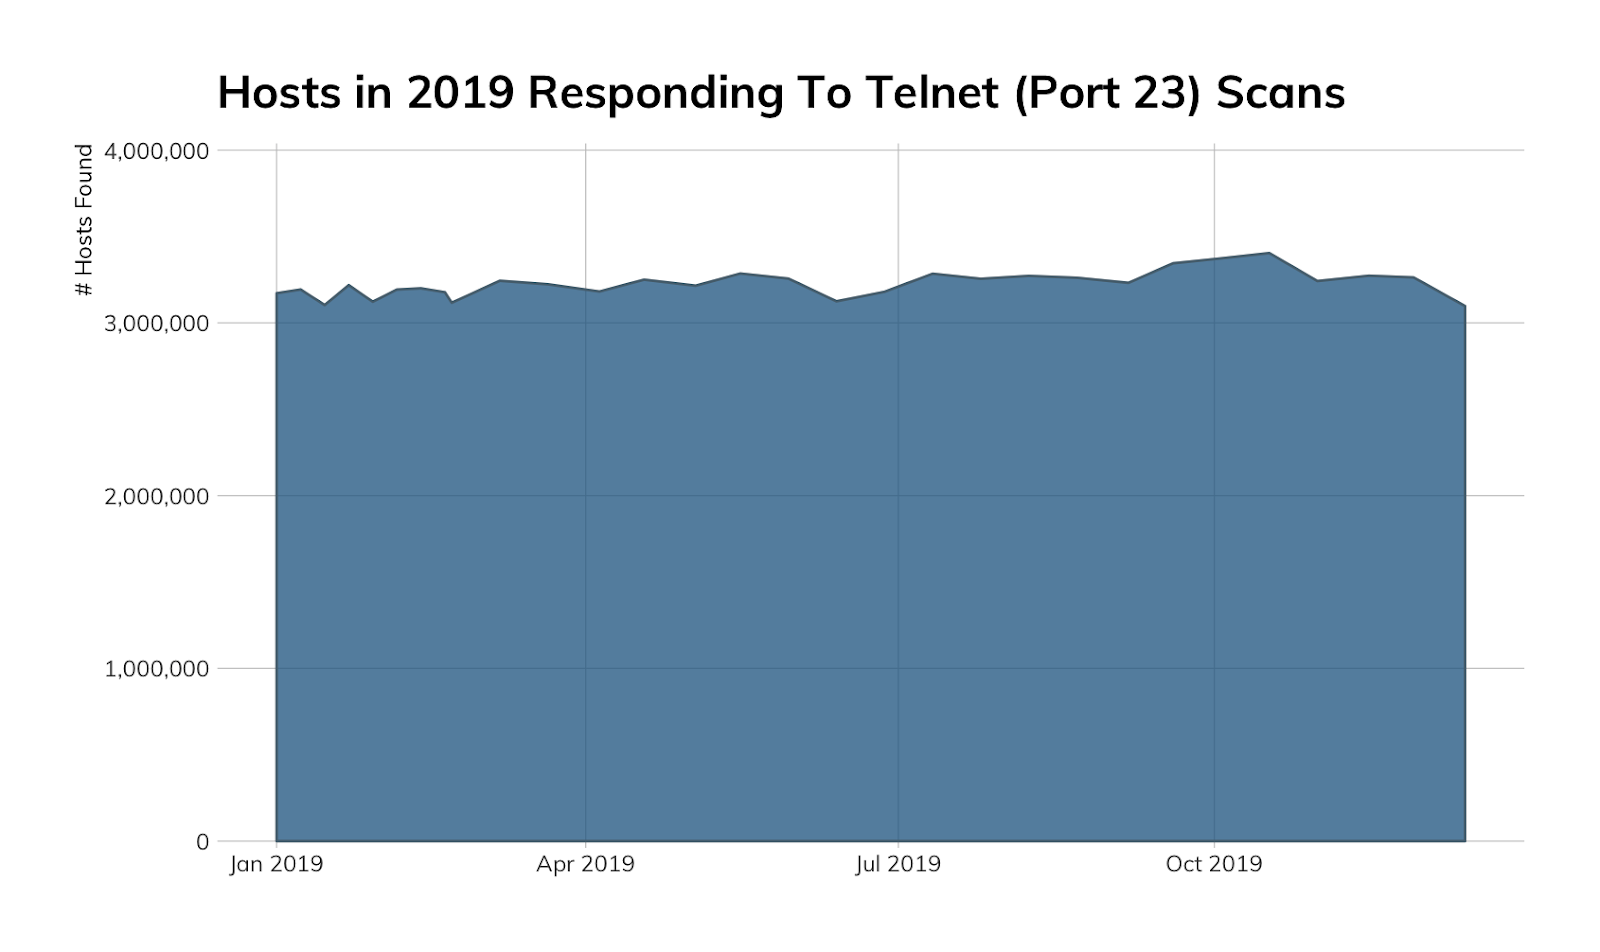
China continues to lead the pack, mostly due to the sheer number of routers and VoIP devices exposing Telnet (the same is true for Japan, Brazil, and most EU countries on the Telnet list):
Telnet Port 23 Host Counts by Country • Dec. 13, 2019 Study
| Country | # Telnet Hosts |
|---|---|
| China | 735,043 |
| United States | 310,905 |
| Argentina | 213,463 |
| Japan | 175,352 |
| South Korea | 161,904 |
| Brazil | 140,221 |
| India | 93,902 |
| Russia | 84,602 |
| United Kingdom | 73,242 |
| Taiwan | 68,130 |
| Canada | 60,343 |
| Mexico | 55,780 |
| Vietnam | 52,461 |
| Italy | 50,977 |
| Hong Kong | 43,809 |
| France | 43,176 |
| New Zealand | 39,672 |
| Thailand | 36,141 |
| Spain | 32,048 |
| Germany | 27,407 |
| Poland | 25,509 |
| Turkey | 24,092 |
| Chile | 23,914 |
| Indonesia | 23,684 |
| Iran | 20,905 |
Given the large number of China-network hosted Telnet systems/devices, it’s no surprise Chinese autonomous systems tend to show up as having the largest percentage of hosts exposing this cleartext protocol.
Telnet Port 23 Hosting Organizations/Networks • Dec. 13, 2019 Study
| Hosting Org | # Telnet Hosts | % |
|---|---|---|
| No.31,Jin-rong Street | 272,369 | 8.79% |
| CHINA UNICOM China169 Backbone | 164,422 | 5.31% |
| Shenzhen Tencent Computer Systems Company Limited | 109,296 | 3.53% |
| Korea Telecom | 105,960 | 3.42% |
| Prima S.A. | 95,761 | 3.09% |
| CABLEVISION S.A. | 93,219 | 3.01% |
| Data Communication Business Group | 50,637 | 1.63% |
| NTT Communications Corporation | 42,806 | 1.38% |
| Guangdong Mobile Communication Co.Ltd. | 41,432 | 1.34% |
| FreeBit Co.,Ltd. | 40,773 | 1.32% |
| University of Canterbury | 37,397 | 1.21% |
| Hathway IP Over Cable Internet | 35,417 | 1.14% |
| VNPT Corp | 34,836 | 1.12% |
| China Mobile communications corporation | 31,773 | 1.03% |
Santa would never use Telnet to connect to his global surveillance infrastructure, and neither should you.
FIN
We’ve made our lists, checked them twice, and shown you who has been naughty (i.e., not nice). Lorelei sees what folks are hacking; knows what they’re trying to take; Sonar identified hosts that’ve been bad (i.e. not good), now it’s time for the Labs’ elves to take a well-earned break.
You’d better watch out, because we still see WannaCry; you’d better not pout, I’m telling you why: Rapid7 Labs is coming to town in 2020, with even more data and insights to help you understand the makeup of the internet and help defend your organization.
Happy holidays to all, and to all a good night!