Last updated at Mon, 11 Mar 2024 17:44:55 GMT
This post is the second—and last—in a two-part series that covers defending your Windows environment against offensive PowerShell. To catch up, check out Part 1, “The PowerShell Boogeyman: How to Defend Against Malicious PowerShell Attacks.”
Hello! My name is Josh Frantz. I work as a security consultant for Rapid7 and am back again to discuss how to get logs into your SIEM and create custom alerts to detect certain behaviors in those logs. We will be using InsightIDR, Rapid7’s incident detection and response tool, in this example, but the configurations should work with any tool.
As recommended in Part 1, let’s say you have all of your endpoints logging PowerShell commands via Group Policy. Fantastic! However, how do you get all of those logs into your SIEM? This seems like a daunting task, but it’s actually much easier than you’d expect. We will be using NXLog and Windows Event Forwarding (WEF), something you’ve (probably) never heard of.

Image source: ImgFlip
What is Windows Event Forwarding?
Simply put, Windows Event Forwarding (WEF) is a way you can get any or all event logs from a Windows computer, and forward/pull them to a Windows Server acting as the subscription manager. On this collector server, your subscription setting can either pull logs from your endpoints, or have your endpoints push their logs to the collector. Either way, this process uses WinRM, so there is no need to install additional software in order to get the logs to this collector.
This approach provides several benefits:
- Scalable: New machines are automatically enrolled in the defined subscription based on organizational unit.
- XML-Based: You can use your favorite version-control software to control configurations.
- Encrypted: Events are sent using Kerbero and encrypted by default.
- Lightweight: Both across network usage and resource consumption.
To start, you will need a collector server (not an InsightIDR collector, but a Windows Server). For up to 5,000 endpoints, a virtual machine with 2 CPU cores and 8GB RAM should do the trick. Beyond that, we recommend 4 CPU cores and 16GB RAM. From our development environment, here is what we monitored across a 24-hour collection period for 2,500 endpoints:
- 500,000 logs pulled
- 3GB bandwidth used on LAN
- CPU did not exceed 10% usage
- RAM did not exceed 50% usage
Okay, so how do I set this up?
After you’ve provisioned your server, we will assume three things:
- Your collector server has access to all your endpoints’ Event Logs (hint: Use the “Log Readers” domain group for this).
- Your endpoints and collector server must have WinRM-enabled.
- You can create a Group Policy that sets up a subscription manager on all your endpoints (if you’re pushing endpoint events to the WEF collector).
Step 1: Log into your collector server, and as an administrator, run Event Viewer. In the console tree, click Subscriptions. It will prompt you to start the service, which is used to collect events. Select Yes.
On the Actions menu, click Create Subscription. Fill out the name and description, then select a Destination Log (by default, the forwarded logs are put in the Forwarded Events log set). For our purposes, we will use the Collector Initiated subscription type. Click the Select Computers button, and add the appropriate AD groups or computers from which you will collect logs. You can test the connection from the Collector server to a computer by pressing the Test button.
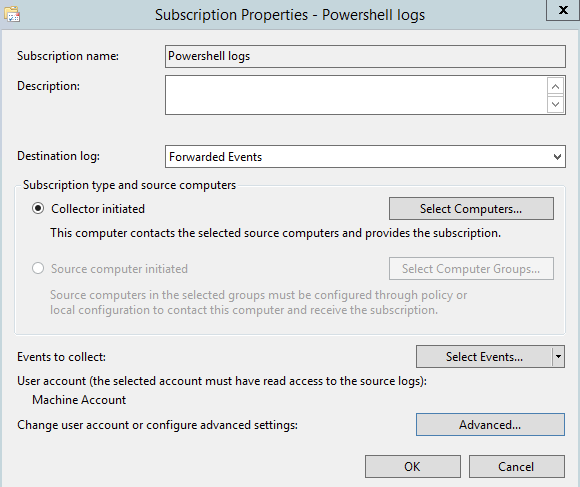
Here is where it gets good: You’re going to create a subscription to pull in events related to PowerShell transcription logging—so, if someone runs PowerShell, you get the event log for it on your Collector. This XML template logs event ID 4104 within the PowerShell log set on each computer with logging enabled.
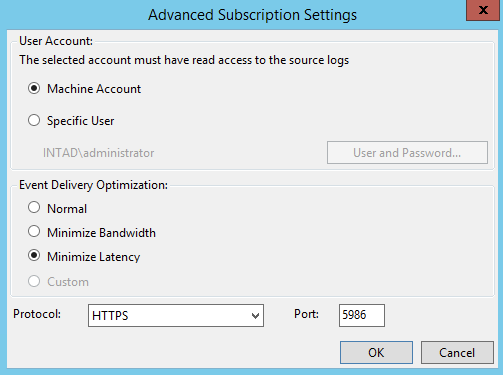
Therefore, hit the Select Events button, and paste in the above XML in the XML tab. The Advanced section allows you to select a specific machine or user account, but for now, use the machine account of the server. For Event Delivery Optimization, we’ll set it to Minimize Latency.
Here’s a breakdown of your options:
- Normal: This option ensures reliable delivery of events and does not attempt to conserve bandwidth. This is not the appropriate choice if you need the events to be forwarded as soon as possible or you need tighter control over your bandwidth. It gets the events every 15 minutes via a pull delivery mode.
- Minimize Bandwidth: This option limits the use of network bandwidth for event delivery, and is appropriate if you want to limit the frequency of network connections used to deliver events. It uses a push delivery mode, with a heartbeat interval of six hours.
- Minimize Latency: This option ensures events are delivered with minimal delay. It is an appropriate choice if you are collecting alerts or critical events. It uses a push delivery mode of every 30 seconds.
From here, I set the protocol to HTTPS and left the default port of 5986. Again, make sure this computer account or the user you select can indeed read the event logs on your target assets.
After a few minutes, logs should start coming into the designated log set.
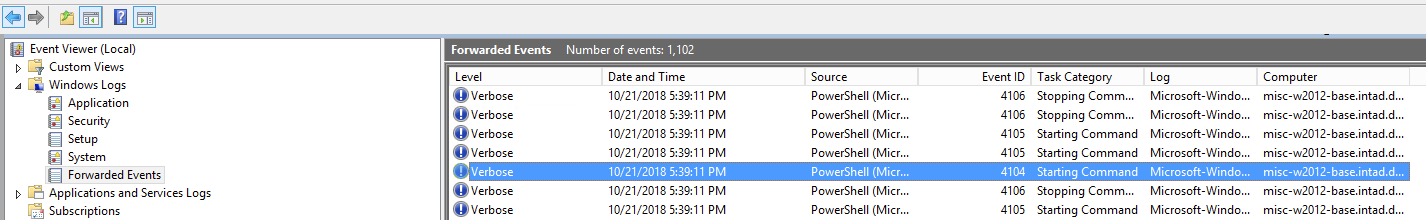
Now, you have all your PowerShell script blocks in one centralized location. Therefore, if someone runs PowerShell on a monitored endpoint, you can have direct visibility right from your SIEM.
Now what?
Step 2: Send your newly centralized logs into your SIEM or log management system. For this, we’ll use NXLog to ship the information we need into InsightIDR. Finally, we’ll create some custom alerts to detect malicious commands being run in your environment.
What is NXLog?
NXLog Community is a free, lightweight tool that is used to ship data via syslog to different platforms and interfaces. For more of the particulars, you can read up on installing and configuring NXLog here. NXLog will help send our Forwarded Events from our Windows Event Collector to InsightIDR.
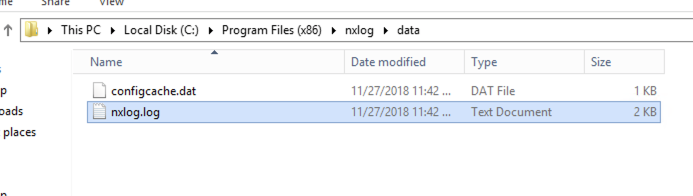
After installing NXLog on your collector server, use the following nxlog.conf configuration file to forward all your PowerShell 4104 events—script block logging messages—to InsightIDR. In short,
- Stop the NXLog service.
- Replace the existing nxlog.conf with an alternative version.
Setting up the Event Source in InsightIDR
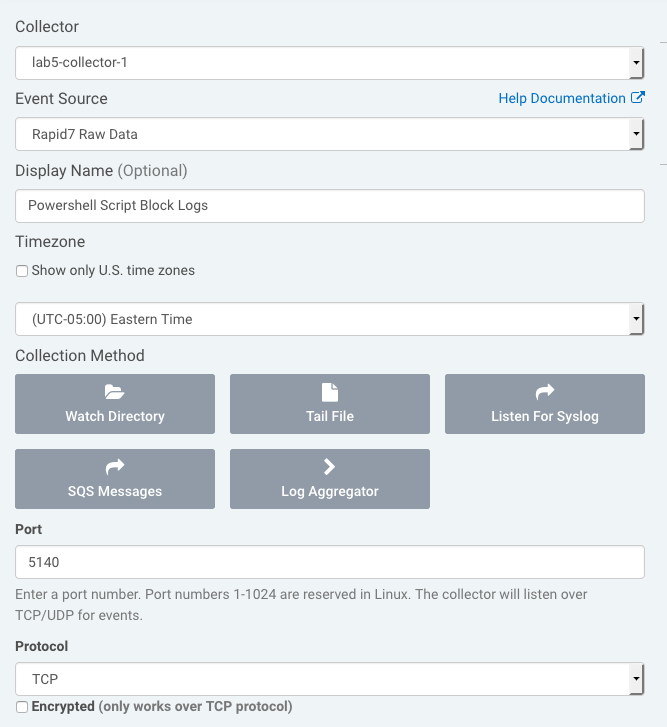
Before you send your logs to InsightIDR, you need an event source set up in InsightIDR ready to receive the logs. This is easily done by creating a new event source under the Custom Logs logset.
- Go to Data Collection, and click Setup Event Source > Add Event Source button on the top-right.
- From there, scroll to the bottom, click Custom Logs, and select Rapid7 Raw Data. Use Listen for Syslog, put in the port used in your configuration, select TCP, and save.
- After you save the event source, you can start your NXLog service. As logs come into your Forwarded Events log set in Event Viewer, NXLog will process those logs and send them to InsightIDR.
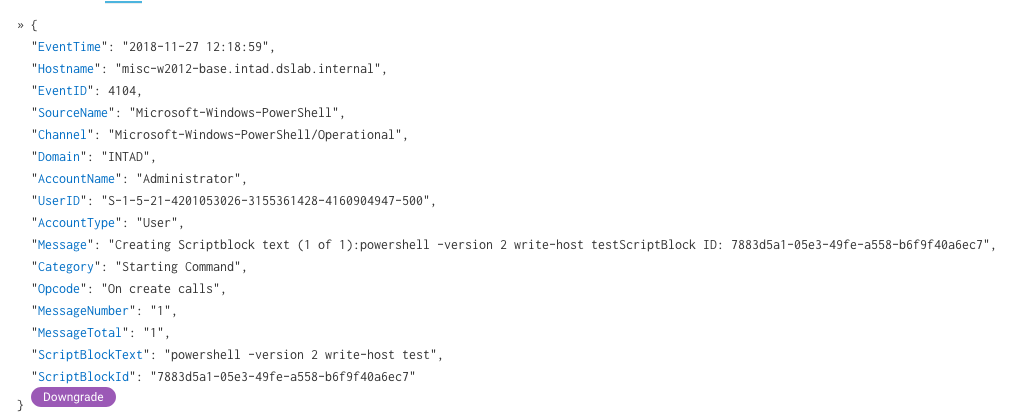
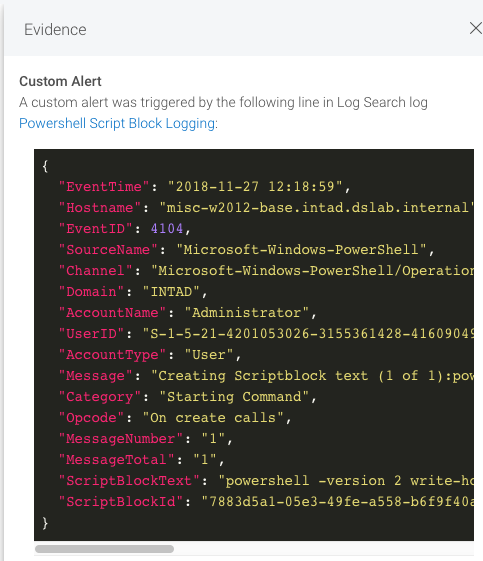
The logs are in JSON format, so they look great inside of your log search.
What to look for with custom alerts
So, it’s awesome to add new to data to your SIEM, but what now? With custom alerts in InsightIDR, you can use these new logs to identify suspicious behavior. When analyzing Powershell activity, there are a lot of potential commands that could be malicious. The below doesn’t encompass all possible attacks, but it’s a great starting baseline.
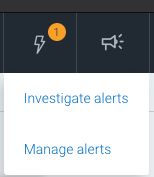
To create a custom alert, hit the lightning bolt at the top-right of your InsightIDR instance, and click Manage Alerts.
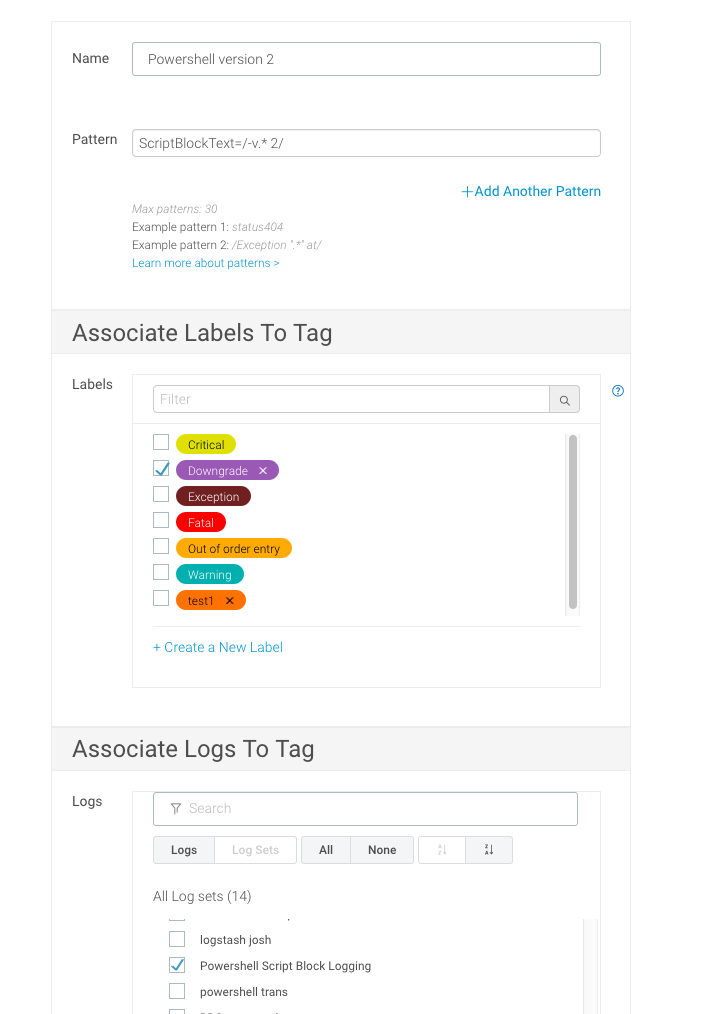
Click on Custom Tags and Alerts, then Add Tag/Alert. This is where you can define a trigger that will alert you if a log matches certain criteria you specify. For this example, we will focus on logs that identify anyone trying to use PowerShell Version 2 (which you shouldn’t allow!).
Fill out the name field accordingly. For the pattern, you can use this simple pattern to identify users running PowerShell V2:
ScriptBlockText=/-v.* 2/
Since you can specify the version with the -version and -v parameters, you have a regular expression that should match both. Then, you can either select a predefined label to associate with this platform match or create a new one (my favorite color is purple, for those wondering). Make sure you select the event source you created earlier.
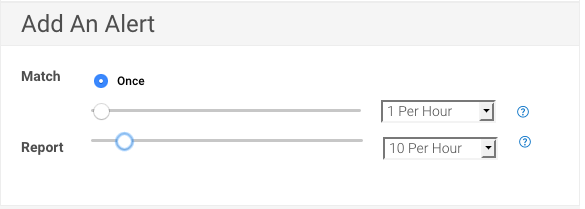
To complete the custom alert, you need to specify both the frequency and minimum threshold that will trigger it. The first section is based on how often this pattern has to happen before you trigger an alert. For this example, we will leave it on the preselected Once. The next field specifies the frequency of the actual alert. I’ve set it to send me 10 alerts per hour, but no more because I don’t want to flood myself with emails.
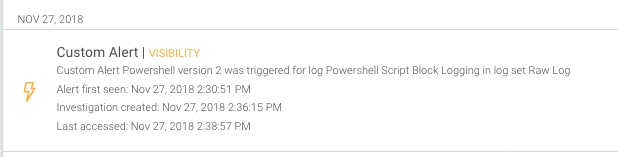
After saving, any log that comes in that matches that pattern will be alerted on, as shown below:
I’ve compiled a list of potentially useful log search queries that can be used as custom alert patterns here on GitHub. Feel free to modify and contribute in any way, as these are just a few examples of commands that could be suspicious. The GitHub link for this blog series can be found here.
As we covered today, Windows Event Forwarding is very useful for sending logs to a centralized location. Paired with NXLog, you can get this data into your SIEM and alert on any behavior you want. If you have any follow-up ideas or thoughts, please drop a comment. Thanks for reading!