Last updated at Mon, 17 Apr 2023 22:38:22 GMT
John Archibald Wheeler, the theoretical physicist who first coined the term “wormhole” (and therefore brought us Deep Space 9) once listed Albert Einstein’s Three Rules of Work:
Out of clutter find simplicity; from discord find harmony; in the middle of difficulty lies opportunity.
These rules seemed fitting for our third quarter threat report. Q3 brought us plenty of clutter, discord, and difficulty, but in this threat report we did our best to turn it into simplicity, harmony, and opportunity. Our goal is to help defenders understand the threats that they are up against and provide concrete guidance on how to reduce exposure to threats and respond to the threats that cannot be mitigated. The Q3 threat report focuses on several trends we identified by combing through data from Rapid7’s SIEM solution InsightIDR, our Managed Detection and Response Service engagements, and R7 Labs research data, as well as provides ways that defenders can check for similar trends in their own data in order to mitigate threats. Some of the findings in the full report include:
The more things change, the more they stay the same.
Recent high-profile breaches and an increase in ransomware did very little to change the overall tempo or intensity of threats across our entire data set. The averages stayed pretty much the same as they did in our Q2 threat report, with the same trend of increased activity on work days, indicating that social engineering and user interaction are still adversaries’ prefered attack vectors. What does this mean for defenders? It means that even with high profile-breaches and attacks we all read about in the news, the threat landscape does not often change quickly or immediately—but that doesn’t mean it won’t change. We recommend that defenders take the chance now—while things are still quiet for some of us—to understand more about new attack vectors and adversary tactics before they become a common occurrence.
The call is coming from INSIDE the building…
Sometimes our networks are our own worst enemies, especially when we have tools or programs that the attackers can use against us. One example of this type of tool is PsExec, a remote administration tool for Windows systems that adversaries love to use to their advantage too! One of the problems we highlight in this quarter’s report is that the inconsistent use of this tool in legitimate network administrative functions makes it very difficult to identify a baseline we can use to determine what is normal in an organization. In a week-by-week analysis of PsExec usage, we were not able to find any sort of patterns of activity. Zero. Not even when we tried REALLY HARD to find trends. This makes identifying attacker behavior (as opposed to legitimate usage) much more difficult for defenders. Adversaries are going to keep using these tools against us, so the best bet is to stop using them (and having them on our networks) in favor of more secure options.
Not all cyber-pathogens (or industries) are created equal.
It's influenza season in the United States, which makes it a great time to take a look at the cyber-pathogen (a.k.a. "malware") landscape through the lens of VirusTotal ("VT" for short) scores. As potentially new malicious samples make their way in and out of organizational cyberdefenses, they often get sent up to VT to be checked against a cadre of detection engines which results in a score, e.g., "7 out of 66 engines identified this sample as malicious." The resultant score is the "detection ratio" and we can take a look at the aggregate view of detection ratio data based on malware samples collected in InsightIDR. For the views here and the ones in the report-proper, we’re just looking at overall volume. That is, we aren’t breaking things down by uniqueness and include no further temporal component than the initial ratio check. Future reports may dive deep into those topics, but we believe this “50,000 foot” view sheds some useful light on a fairly opaque topic.
We'll look first at the overall VT detection ratio for Q3:
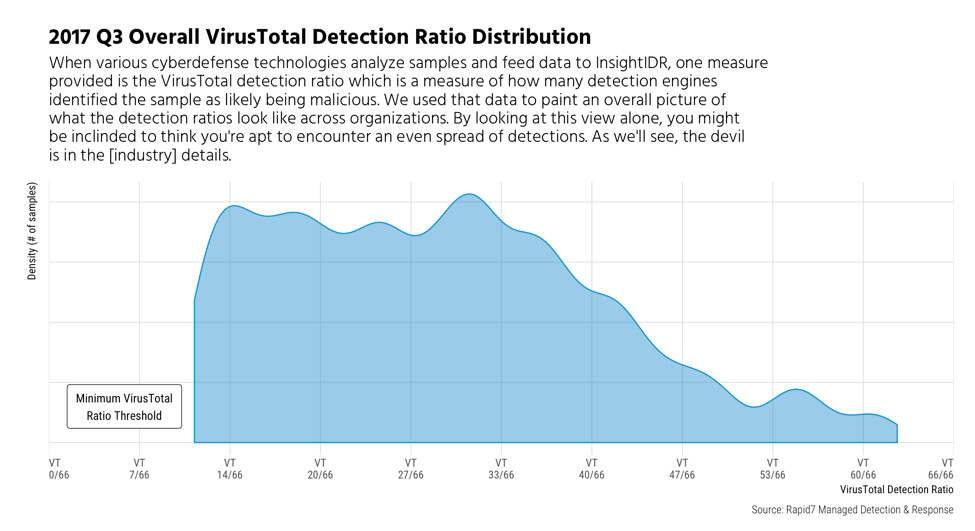
As noted in the report, higher ratio could indicate that a malware found has been around for a long time; or, it could just mean that it is easier to detect. Conversely, lower ratios may mean that a sample is fairly new or that a sample is more difficult for some scanners to identify as malicious. Don't let the previous chart lull you into thinking you'll see an even spread of middling detections! The view gets much more interesting when we do the break out by industry:
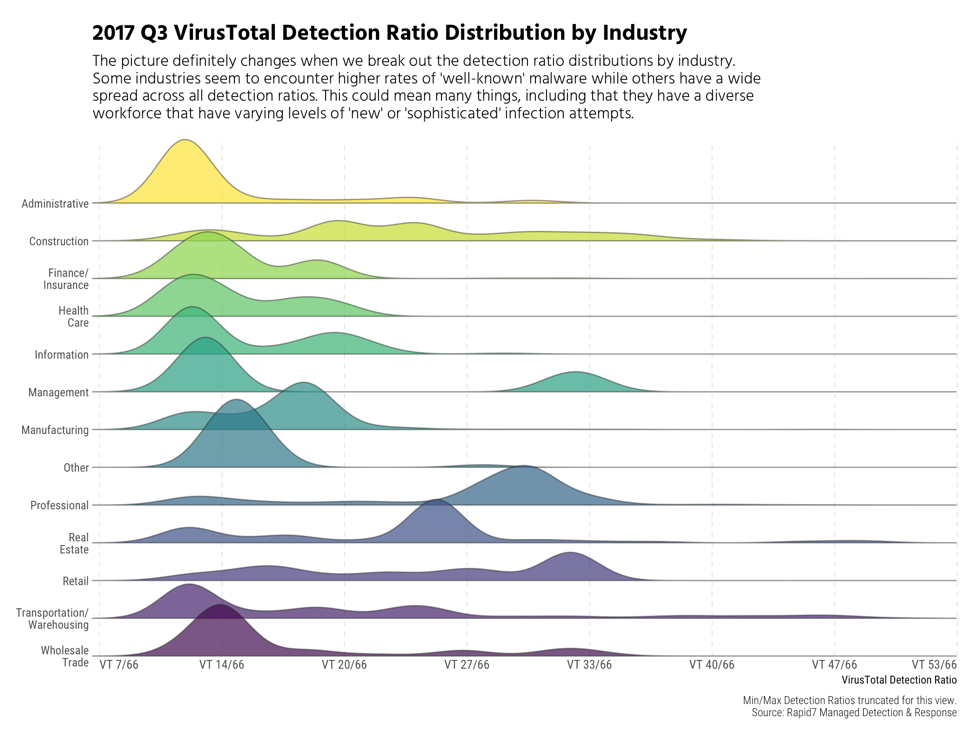
Construction stands out as having a diverse spread of VT ratios, which means, in part, that they encounter a broad spectrum of new and targeted malware attacks. Organizations in Professional and Real Estate industries appear to encounter more common (or already seen) malware, while many others fall at the lower end of the detection spectrum.
While it's vital to understand the details of individual malware components that are part of specific incidents you triage, it also pays to look at this aggregate view to give you a better understanding of the nature of the threats your industry faces as a whole. You can compare your detection profile—you likely also have cyberdefense components that generate VT ratios or similar ratios from other services—to the industry and aggregate views here to see if you fit the overarching profile or have a much different view. Either way, you'll have a data-driven view to help better manage risk in your organization.
That’s a wrap for Q3! Don’t forget to grab a copy of the report and stay tuned for our Whiteboard Wednesday overview. And, remember—we :heart: feedback! Tell us what you :thumbsup:, :thumbsdown: or would like to see in our Q4 edition by shooting us a note. We’ll leave you with Ferengi Rule of Acquisition #92 (something all responders should heed well): “Never confuse wisdom with luck.”