Last updated at Sat, 19 Aug 2017 11:10:24 GMT
What are Heroku Dynos?
 If you've ever hosted an application on Heroku, the popular platform as a service, you're likely at least aware of the existence of “Dynos”. But what exactly are Heroku Dynos and why are they important?
As explained in Heroku's docs, Dynos are simply lightweight Linux containers dedicated to running your application processes. At the most basic level, a newly deployed app to Heroku will be supported by one Dyno for running web processes. You then have the option of adding additional Dynos and specifying Dyno processes in your procfile. Dynos actually come in three different flavors:
- Web Dynos: for handling web processes
- Worker Dynos: for handling any type of process you declare (like background jobs)
- One-off Dynos: for handling one-off tasks, such as database migrations
One of the great things about Heroku Dynos is how easy they are to scale up and out. Through Heroku's admin portal or via the command line, you can easily add more Dynos or larger Dynos. Adding additional Dynos can help speed up your application's response time by handling more concurrent requests, whereas adding larger Dynos can provide additional RAM for your application.
Using Heroku Dynos to get the insights you need
Great. I get it. Dynos make it easy to run my application with less hassle. For this reason, I should have to think very little about Heroku Dynos, right? Wrong!
As Dynos are individual containers and identified uniquely in your Heroku logs, they can provide some great insight into where issues may be stemming from when things go wrong.
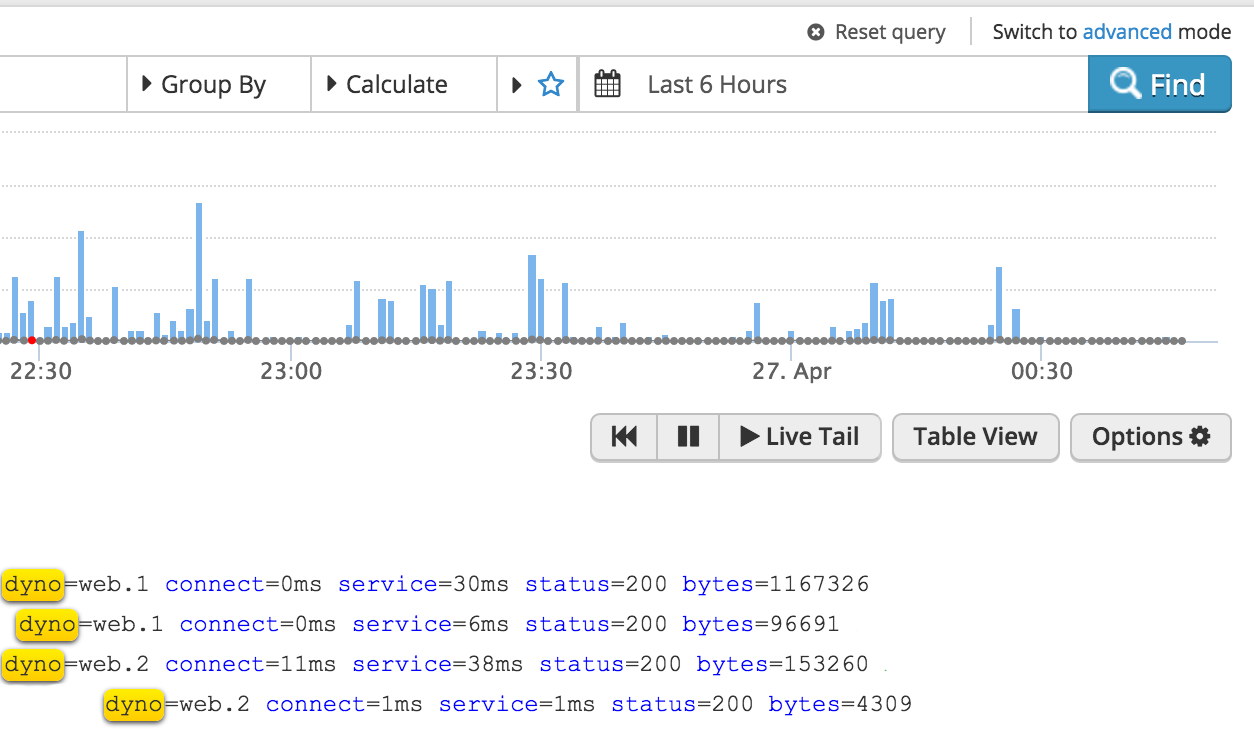
When sending Heroku logs to InsightOps, a Dyno's unique ID will automatically be logged in key-value pair format along with information about the process it handled. In the example below, we see web Dynos being identified along with the HTTP requests being handled:
An easier way to view this data in InsightOps is to use the Table View:
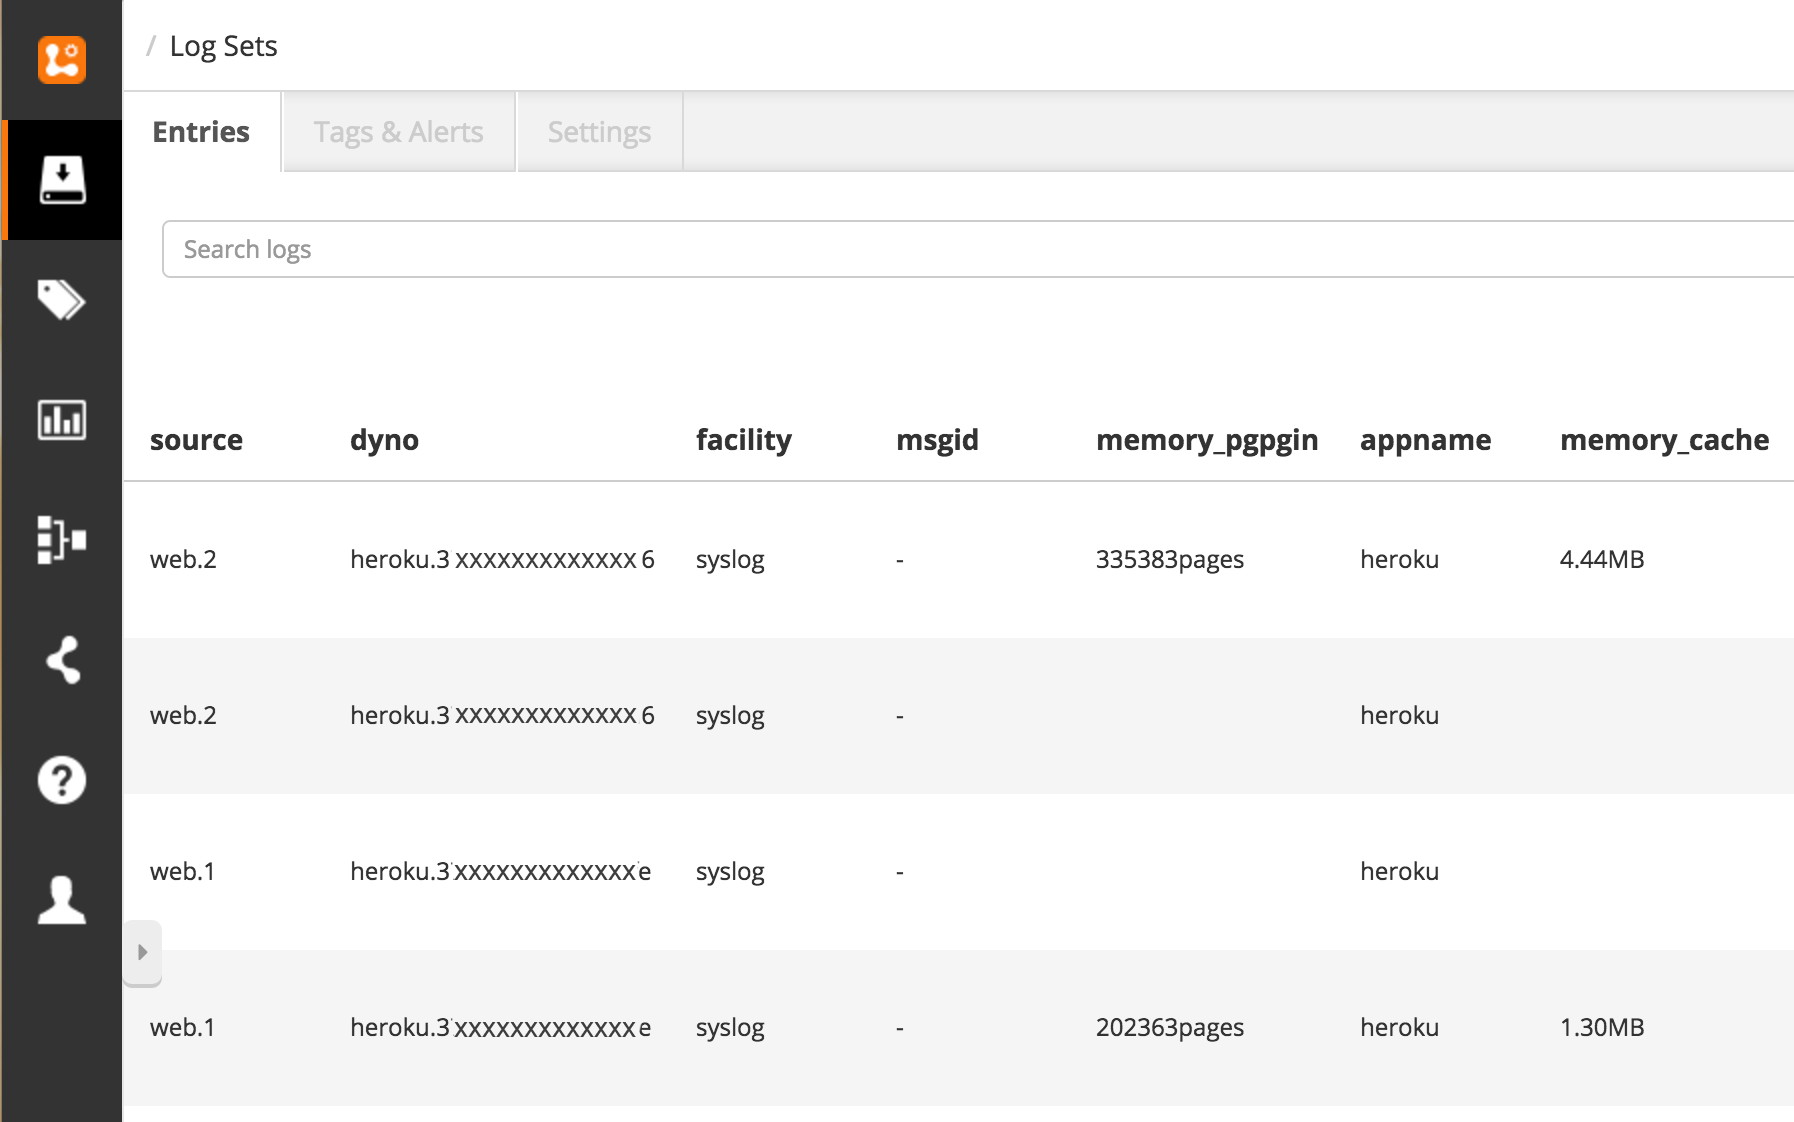
As you can see, the Heroku Dyno is easily identified along other pertinent data. Since I've enabled Heroku's beta log-runtime-metrics from Heroku Labs, I can also see data related to CPU and memory per Dyno, which is particularly useful for identifying issues like too much swap memory being used (perhaps indicating a need to scale up my Dynos).
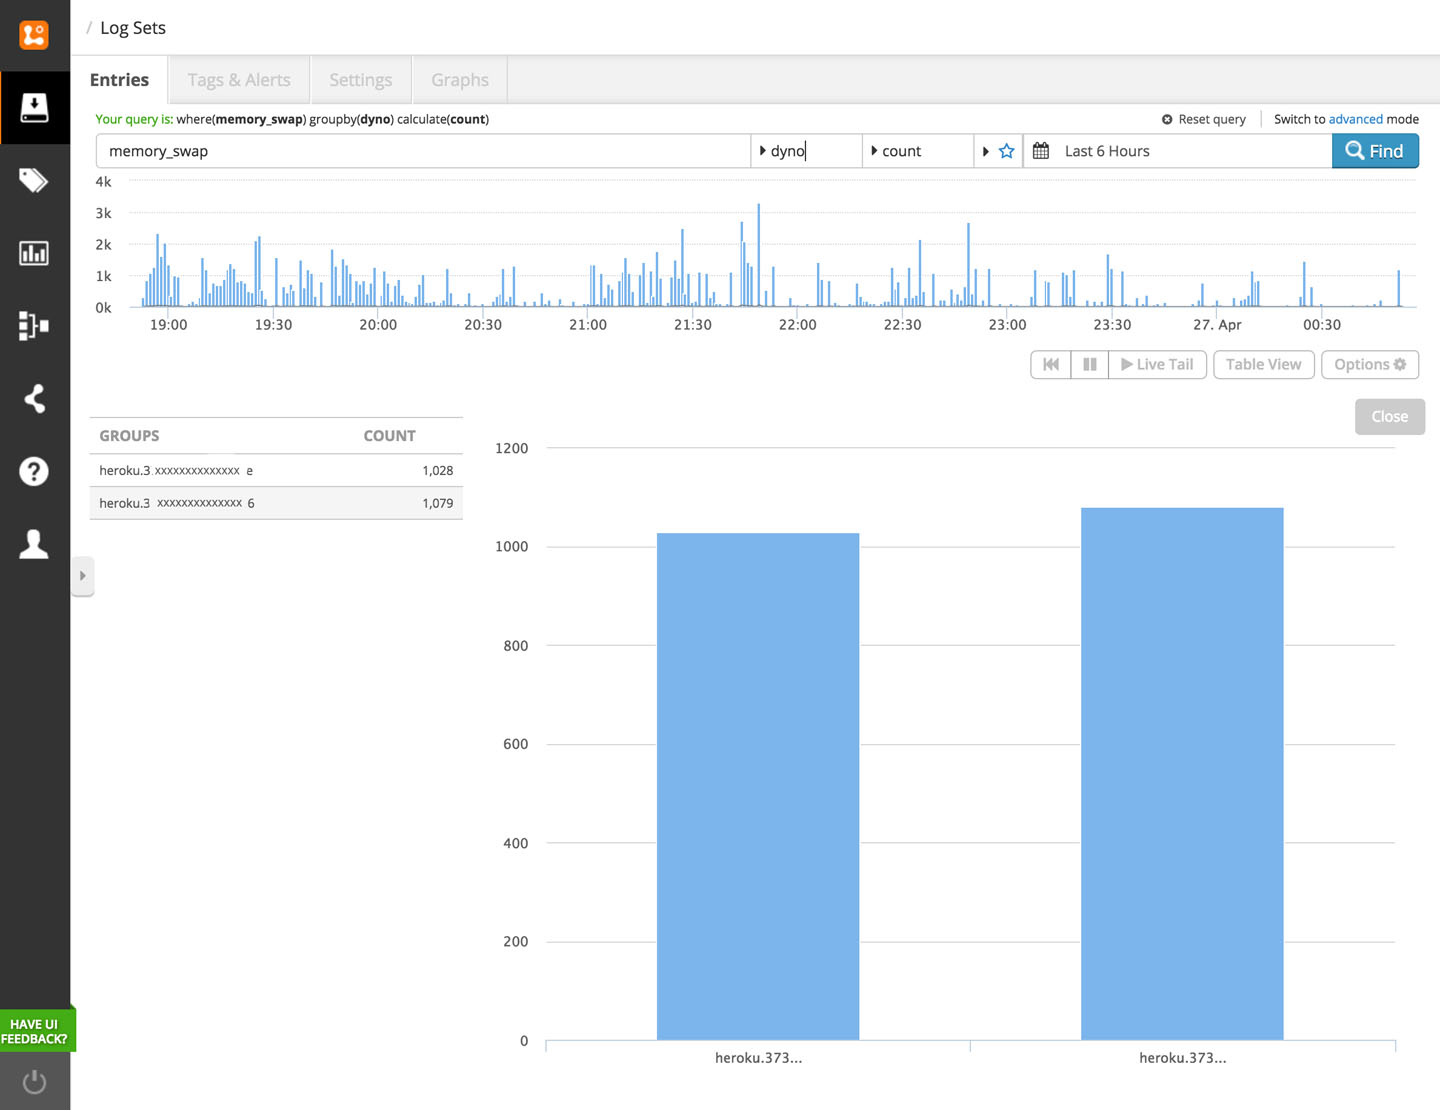
Since Dynos are uniquely identified in key value pairs, you can also use them to visualize data. In the example below, I'm visualizing how much swap memory each Dyno is using over a given period of time:
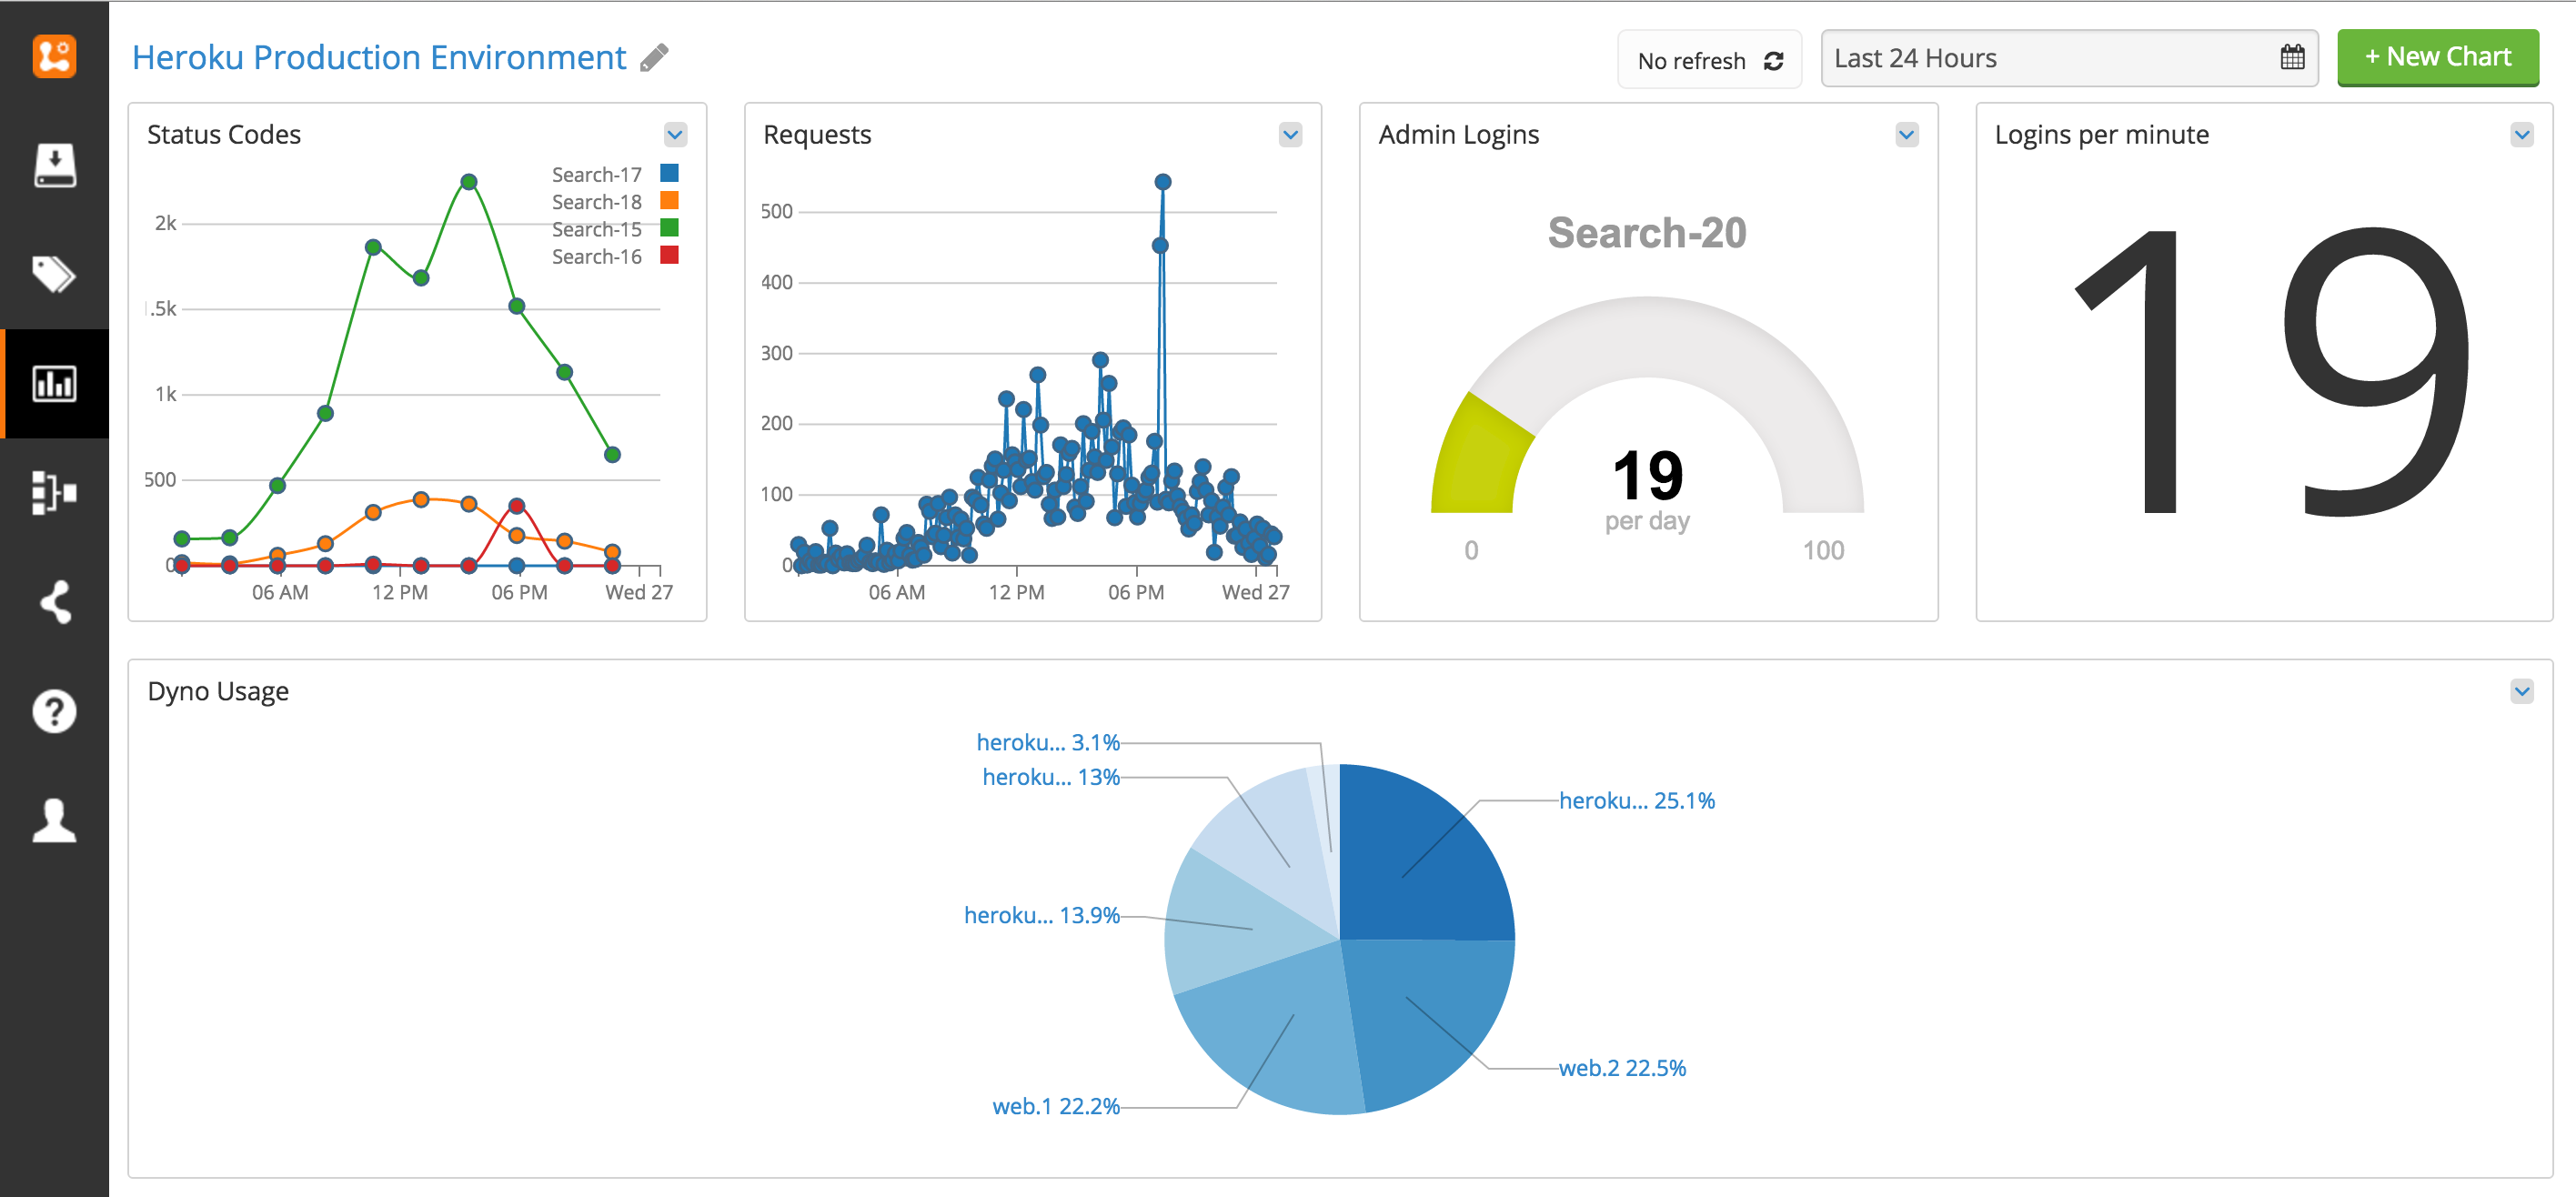
You can also create visualizations to help you monitor how much each Dyno is being used compared to others:
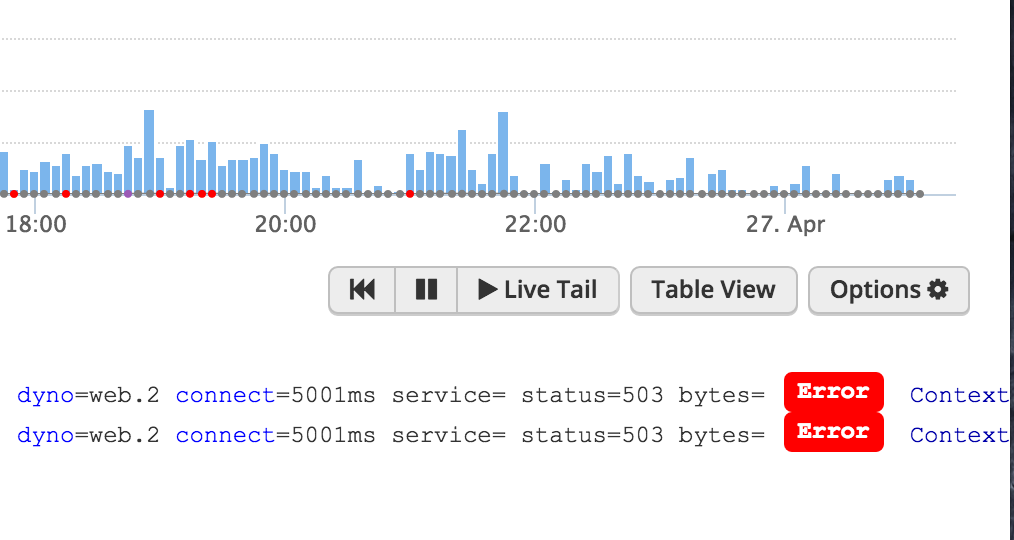
Finally, checking the Heroku Dyno related to errors in your logs could hint at Dyno-related issues. In the example below, we see that Dyno web.2 is related to both errors, which happen to be backend connection timeouts. While Heroku Dynos are allowed to fail and automatically restart on a different server, this finding could warrant you manually restarting your Dynos to alleviate the issue.
Start logging with Heroku Dynos today
Ready to start logging from your Heroku app today? Check out our free log management tool.