Last updated at Wed, 13 Dec 2017 18:15:43 GMT
Synopsis
Tcpdump, as the name suggests, captures and dumps(writes) the network traffic passing through a given server’s or node’s network interfaces . It is a classic command line tool written in 1987 and remains one of the most powerful tools for analyzing network traffic. Many options and filters available in the tool makes it easier to slice and dice the data. The data then can be used by network administrators and enthusiasts for many purposes such as, security & forensic analyses, trouble shooting & network administration or simply to understand and learn the gory details of the network in real time.
Installation of tcpdump
One of the reasons the tool is very popular is, it comes pre-packaged in most of *nix lineage operating systems including MacOS. One usually requires super user privilege but exceptions can be made for specific users using -Z option. Latest versions can be downloaded from the official site http://www.tcpdump.org/.
Window specific tcpdump version is available from http://www.winpcap.org/windump/. There is even an Android version ready at http://www.androidtcpdump.com/.
TCP/IP Quick Reference and Network Configuration
In order to make sense of the data written out by tcpdump, one needs a good grip on the TCP/IP protocol stack, state transitions, handshakes, sequence flows and the packet details. The stack and the packet level details of the three of the most important protocols are listed below as a starting point. Many common scenarios in network troubleshooting can be deciphered with the help of these.
TCP/IP protocol stack is translated to four layers. The dominant protocols in each layer is mentioned in the bracket. All data captured translates to one of these.
- Application Layer (HTML, FTP, TELNET, SNMP)
- Transport Layer (TCP, UDP)
- Network Layer (IP, ARP, IGMP, ICMP)
- Link Layer (Ethernet, Tokenring)
IP Header :
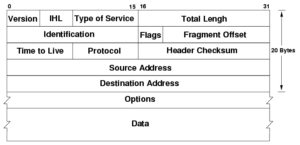
(Image credit : public domain image at wikimedia)
.png?uselang=en-gb)
UDP Header :
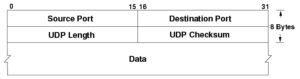
(Image credit : public domain image at wikimedia)
TCP Header :
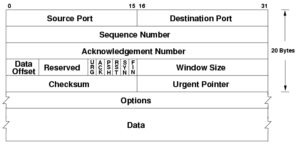
(Image credit : Public domain image Wikimedia)
Please note in order to capture the data one needs to be on the right network configuration that has interfaces receiving all the traffic. Make sure the hub/router that you are plugged into is configured to receive the packets and not in unicast node. More information on the interface configuration can be gathered at http://www.tcpdump.org/faq.html#q4
Using tcpdump Tool for Network Analyses
As per the manpage, the synopsis usage of the tool is as below.
tcpdump [ -AbdDefhHIJKlLnNOpqStuUvxX# ] [ -Bbuffer_size ]
[ -ccount ]
[ -Cfile_size ] [ -Grotate_seconds ] [ -Ffile ]
[ -iinterface ] [ -jtstamp_type ] [ -mmodule ] [ -Msecret ]
[ –number ] [ -Qin|out|inout ]
[ -rfile ] [ -Vfile ] [ -ssnaplen ] [ -Ttype ] [ -wfile ]
[ -Wfilecount ]
[ -E*spi@ipaddr algo:secret,…* ]
[ -ydatalinktype ] [ -zpostrotate-command ] [ -Zuser ]
[ **–time-stamp-precision=**tstamp_precision ]
[ –immediate-mode ] [ –version ]
[ expression ] ****
The flags are used to format and get a particular view of the data flowing through. The “expression” is a list of filters and are part of the underlying pcap library.
With so many options available it can be quite overwhelming if there is no clear understanding of the network events, packet headers and utility of each flag and filter. For beginners though, one good place to start the network analyses is by listing down the interfaces in the system. Then one can make the commands progressively complex and analyze the traffic and nodes which are directly and indirectly connected to that system. A sample sequence of commands is covered below (Note : these need superuser privileges and the data dumped is representative).
tcpdump -D
which produces results similar to
 1.eth0
 2.eth1
 3.any (Pseudo-device that captures on all interfaces)
one can then listen on a specific interface using -i flag,
tcpdump -i eth0
This produces something similar to the result below
19:46:45.124065 IP 17.171.49.28.443 > 192.168.1.100.52352: Flags [F.], seq 2585193626, ack 2968158400, win 96, length 0listening on eth0, link-type EN10MB (Ethernet), capture size 262144 bytes

19:46:45.124187 IP 192.168.1.100.52352 > 17.171.49.28.443: Flags [.], ack 1, win 8192, length 0

19:46:45.886668 IP 192.168.1.100.52314 > 17.252.124.38.5223: Flags [P.], seq 2424398971:2424399072, ack 2602778718, win 4096, options [nop,nop,TS val 1048088605 ecr 3172137507], length 101

19:46:48.183959 IP 192.168.1.100.52314 > 17.252.124.38.5223: Flags [P.], seq 0:101, ack 1, win 4096, options [nop,nop,TS val 1048090902 ecr 3172137507], length 101

19:46:51.522036 IP 192.168.1.100.52314 > 17.252.124.38.5223: Flags [P.], seq 0:101, ack 1, win 4096, options [nop,nop,TS val 1048094239 ecr 3172137507], length 101

19:46:52.088437 IP 74.125.68.189.443 > 192.168.1.100.61699: UDP, length 443

19:46:52.114872 IP 192.168.1.100.61699 > 74.125.68.189.443: UDP, length 39
3rd line in the result above can be deciphered as, captured at timestamp 19:46:45.124187, the packet captured is an IP protocol, which is originated at IP Address and port 192.168.1.100.52314 and is destined (notice the direction of the arrow) for 17.252.124.38.5223 ack flag is piggybacked in this packet.
Control messages such as ICMP can be good indicators to understand nodes and systems around you and can be listened to by using filter ICMP.
tcpdump -i eth0 -nnvSs 0 -c1 icmp
Notice the other flags such as -c which limit the packet size (in this case 1) and makes it easier to analyse. -nn is used not to resolve the hostnames as it will save time and -S is used for printing absolute Sequence number.
tcpdump: listening on eth0, link-type EN10MB (Ethernet), capture size 262144 bytes

18:11:55.997564 IP (tos 0x0, ttl 64, id 54245, offset 0, flags [none], proto ICMP (1), length 84)

92.168.1.100 106.10.139.246: ICMP echo request, id 44290, seq 213, length 64
This can be taken up a notch above to the Application layer and filter information specific to applications such as ftp (port 21) , telnet (port 23) or http at port 80 using “port” filter.
tcpdump -i eth0 -nnvSs port 23
Analyses on specific host can be done by adding host filter.
tcpdump -i eth0 host 192.6.7.8
Additionally one can filter the incoming or outgoing traffic using filters **src and dst filters. **
Infinite combinations of the command can be made with the flags and filters but the real skill required is to deduce the scenarios to cut through the noise and get the precise data that would highlight the needed information.