Last updated at Mon, 06 Nov 2017 18:54:47 GMT

Since last year, we’ve anticipated the impact of Docker and have been building integrations – first as experiments and later as full-blown solutions. It’s therefore with great pleasure that we’re announcing our recognition by Docker as an Ecosystem Technology Partner for Logging.
Why Monitor Docker Logs?
Most teams that migrate to a container environment quickly recognize the inherent challenges associated with managing logs from containerized applications. Highly ephemeral in nature and single-serving in purpose, it quickly becomes evident that logging from containers is unlike logging from a traditional VM. Yet logs from containers are no less important than from any other environment. In fact, given the high frequency of events occurring within a container environment (containers starting, stopping, dying, etc.), it becomes more important than ever to interpret application performance in the context of container activity. Container metrics, Docker events and application logs should all be considered in an effort to fully understand what’s happening in your environment. Therefore, using logs as the focal point of a container monitoring solution offers the ability to correlate your most important data in a way that provides both end-to-end visibility and rich context. It was this type of tool we built for Docker.
Building a great Docker Logging Tool Part 1:
A Microservice with API Integration
When working with containers, it’s often considered best practice to limit a container’s purpose to running a single process. When building a logging solution for Docker, we felt it would be counterintuitive to ask users to install a collection agent inside each container. Instead, we built an open-source log collection container to be run as its own microservice amongst your other containers. This decision decouples the log collection process from your other container processes, thus adhering to best practices.
By leveraging Docker’s APIs, the Logentries log collection container collects three levels of data from your Docker environment: application logs, container performance metrics and Docker events, all of which are streamed in real-time to Logentries. By collecting from these three sources, users can better correlate system data with application data. Logs and metrics can be live-tailed for debugging or queried for deeper analytics. To provide further visibility into container logs, we created a robust Docker Insights Dashboard for enhanced data visualization.
Building a great Docker Logging Tool Part 2:
Data Visualization
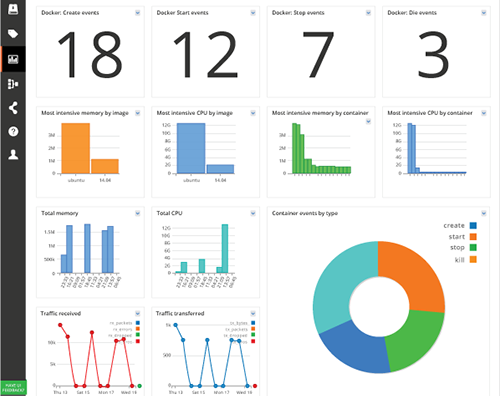
The second step to developing a great Docker log monitoring tool was to build a powerful dashboard that visualizes your application logs, container metrics and Docker events. By delivering this data in one easy-to-use Docker Insights Dashboard, it becomes significantly easier to identify issues that may have previously gone unnoticed. To simplify setup, we decided to have the dashboard provision itself automatically when a Logentries user sends Docker logs within the first 30 days of starting their account. If an existing Logentries user wants to use the Docker Insights Dashboard in the future, it can be easily downloaded for free as a Logentries Community Pack.
What’s Next for Logentries and Docker?
With a best-in-class solution for collecting Docker logs and metrics, followed by a feature-rich Docker Insights Dashboard, we’re turning our attention to expanding the Logentries Query Language (LEQL) to enable deeper analysis and data visualization. While the Docker Insights Dashboard already leverages calculation functions like max, average and timeslice(), future updates to LEQL will give users the ability to calculate multiple values in a single query, specify aliased columns in table views, and more.
Looking to Start Logging from Docker?
What are you waiting for? If you’re not already using Logentries, you can create a free account anytime at logentries.com/docker.