Last updated at Sun, 05 Nov 2017 16:31:43 GMT
Over the last few months, you’ve probably noticed that we’ve been talking about Docker quite a lot – we think this lightweight and powerful way of managing environments is only going to increase in popularity.
Docker has been evolving their logging capabilities with each release, so of course we’re interested in how we can help you get log data from Docker into Logentries for quick and powerful analysis.
In August, we announced a new way to collect and analyze Docker logs for free with our DockerFree offer. Today, we’re announcing a new suite of “Docker Container Insights” – tools including queries, tags, alerts and dashboard widgets to provide deep container-level insights into your Docker environment.
When you start a free Logentries trial and send Docker logs, your account will automatically populate with Docker Container Insights. Already have a Logentries account? Docker Container Insights are also available as our latest Docker Community Pack which can be downloaded for free from the Logentries Community.
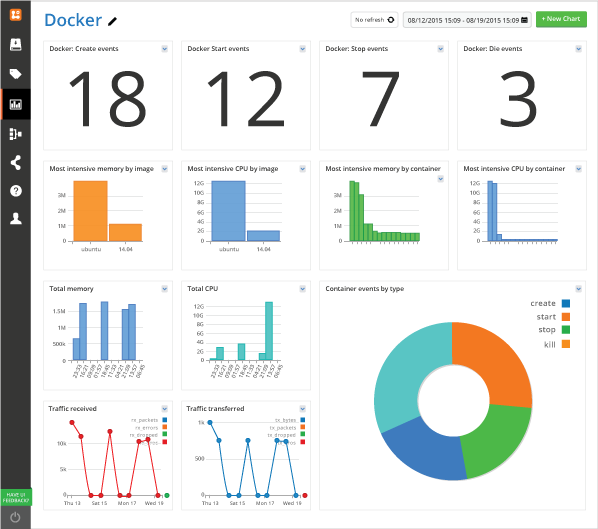
Docker Container Insights and the New Docker Community Pack
Docker Container Insights and the Docker Community Pack provide a variety of preconfigured tools, including:
- Queries for determining total number of containers created, started, stopped and killed, along with queries for identifying containers and images using the most CPU and memory.
- Tags and alerts to notify you of container events, when memory usage is trending up and when you’ve reached maximum CPU.
- Customized timeline graphs and bar charts that provide a detailed overview of network activity across all containers, visualizes average CPU and memory usage for all images and containers and displays a count of container events distributed by event type.
Introducing sort() and timeslice()
If you look at the saved queries used by the new dashboard widgets found in the Docker Community Pack, you’ll see we’re using two new LEQL functions that we recently released: sort() and timeslice().
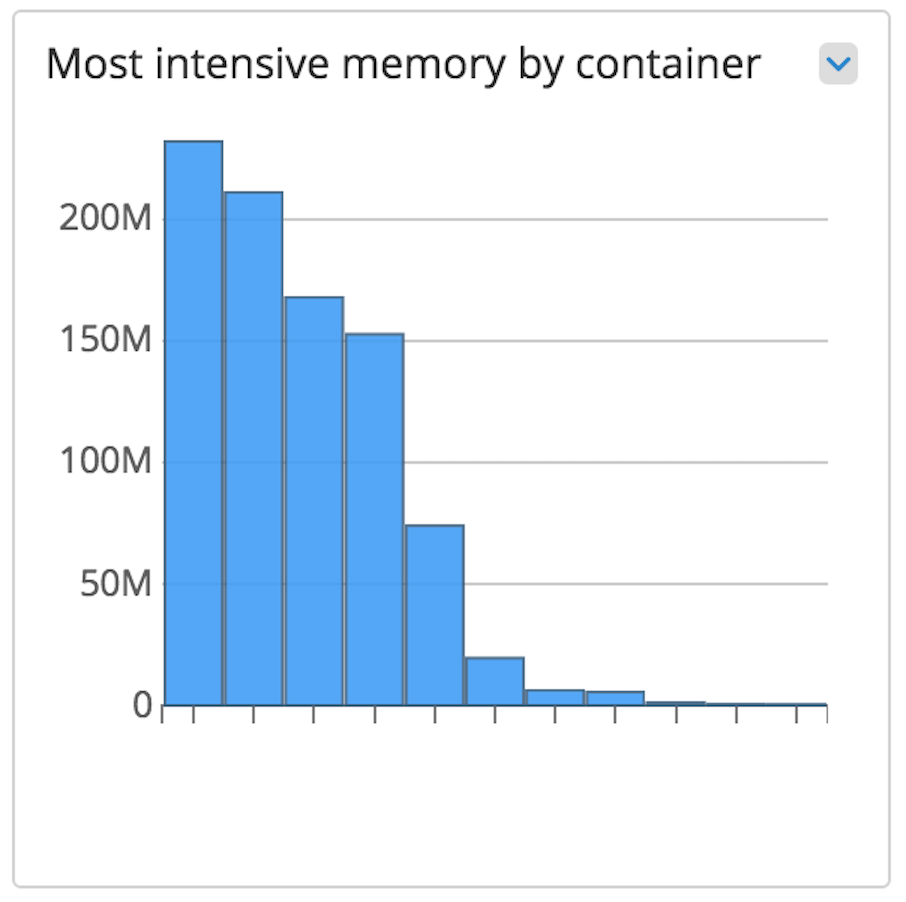
Using sort(), you can now sort the data returned in a groupBy query. For instance, the following query will generate a chart that shows the most memory intensive Docker containers:
where(usage) groupby(name) calculate(average:usage) sort(desc)
Using the query above will yield results sorted in a descending manner. To see the same results displayed ascending, simply replace sort(desc) with sort(asc).
Timeslice() is our newest LEQL function that enables you to specify the frequency of data points in your results. You can add timeslice() to the end of any query grouped by time, specifying the number of “slices” as demonstrated below:
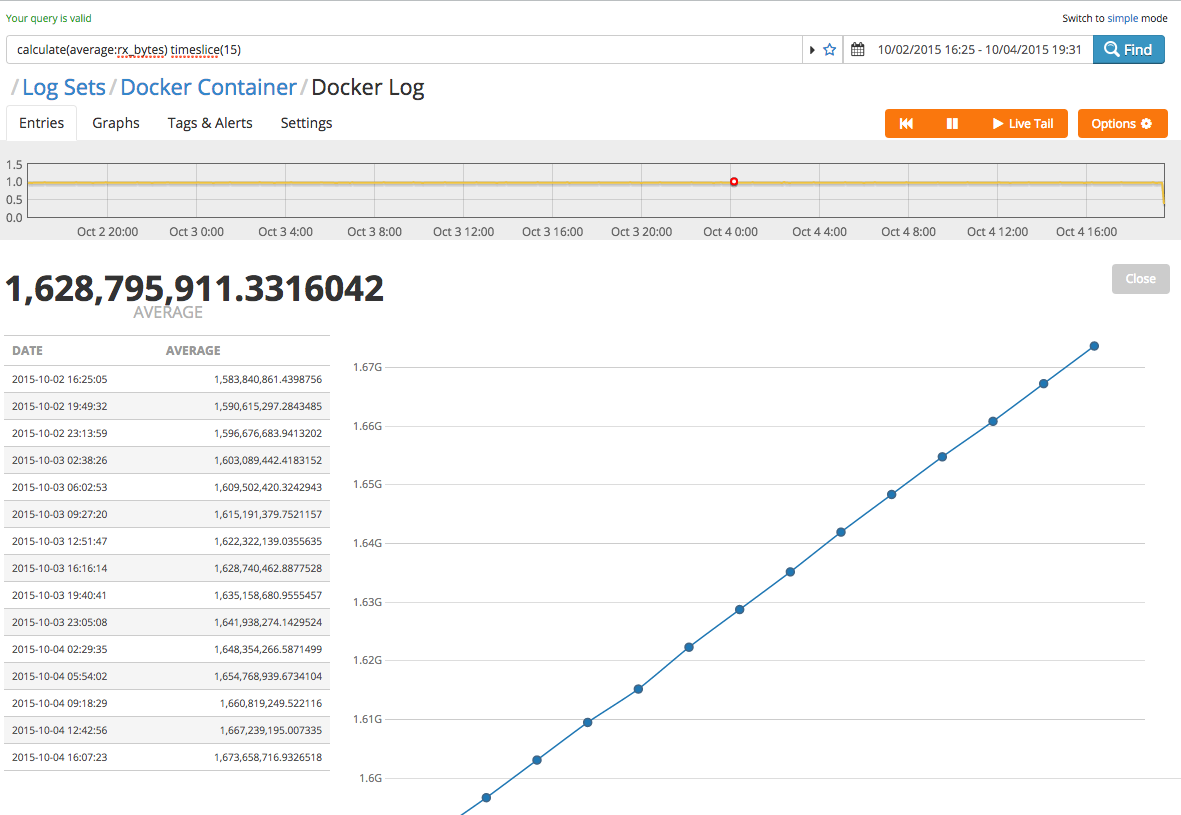
calculate(average:rx_bytes) timeslice(15)
timeslice() is particularly useful in revealing previously hidden trends by enabling you to analyze your data with increased granularity. For example, the aforementioned query would deliver a chart with the results seen below:
Meanwhile, the same query with greater timeslice granularity (as depicted below) would reveal something like this:
calculate(average:rx_bytes) timeslice(100)
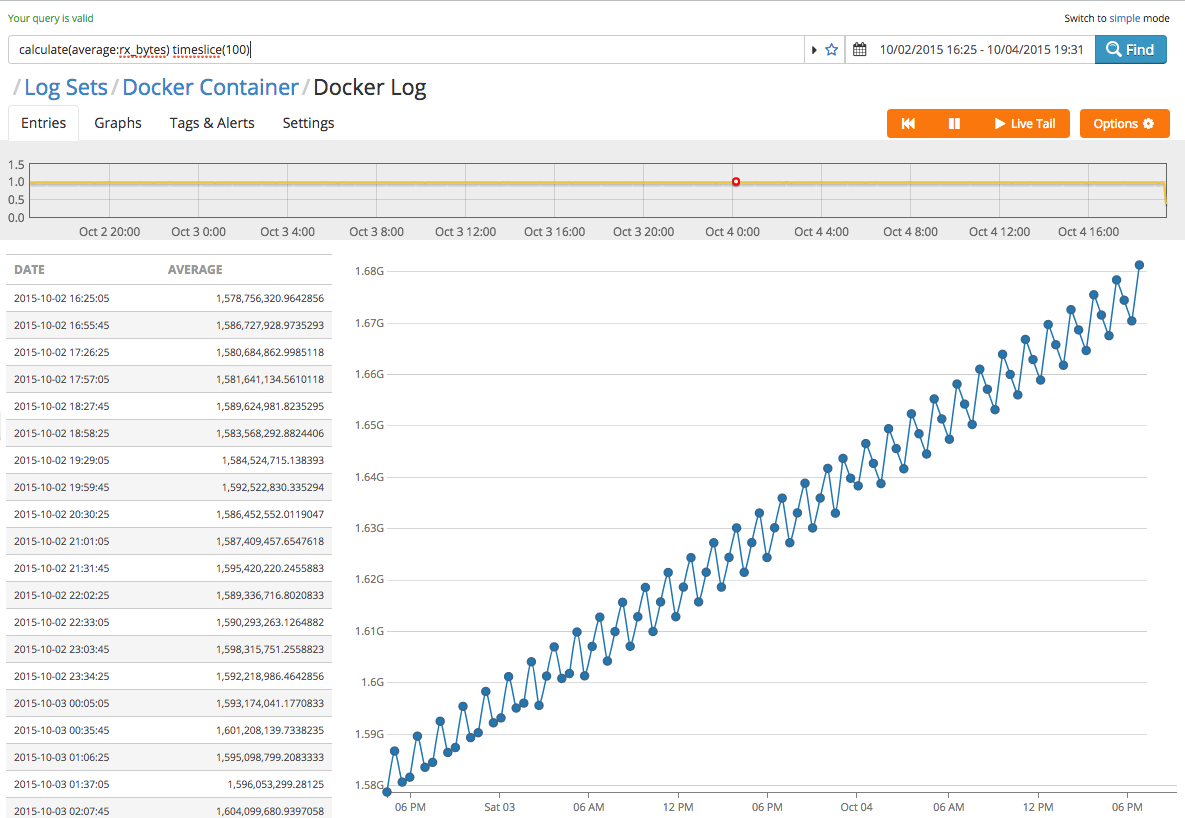
While these two graphs are visualizing the same dataset over the same period of time, the second, more granular graph is clearly revealing more information thanks to timeslice().
What else?
We recently updated our Logentries Docker Logging Container to automatically include the host that your Docker containers and images are on – this will be useful if you’re running Docker across multiple machines; you can use the same log in Logentries when sending your Docker data and use LEQL to group your data by host.
We’ve also added a parameter that allows you to control the frequency at which the metrics are sent to your log in Logentries. To send the data every 30 seconds, simply add -i 30 while starting the Logentries Docker container.
Interested in learning more about logging from Docker and using LEQL? Check out the resources below for more information on how to get started: