Last updated at Thu, 03 Dec 2020 18:46:30 GMT
 Today’s DevOps culture drives the requirement for development and ops teams to share tooling and to combine lots of different services/processes to give them visibility into their systems throughout the system life cycle. For example the modern DevOps toolkit will consistently include the following categories of tools (and more…):
- APM (e.g. New Relic, AppDynamics, AppNeta, AlertSite)
- Team Communication (e.g. Slack, Hipchat)
- Server Monitoring (e.g. CloudWatch, ScoutApp, DataDog)
- Alert Management (e.g. PagerDuty, VictorOps)
- Configuration Management (e.g. Chef, Puppet)
- Data Visualization & Metrics (e.g. Graphite, Geckoboard)
- Log Management and Analytics (e.g. Logentries, ELK)
- Error Tracking (e.g. Raygun, Airbrake)
- Data Archiving & Backup (e.g. S3, Google Cloud Storage)
Many of the these tools are very much complementary and are often used together to help solve key issues. For example a large percentage of Logentries users will use it in conjunction with New Relic when troubleshooting system performance issues; the APM solution often showing ‘what’ went wrong and the logs giving a more fine-grained view of ‘why’ the issue occurred.
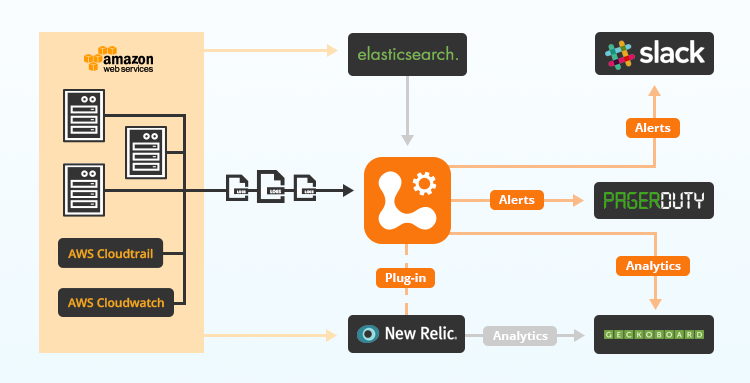
In fact we regularly see the following workflow with Logentries users:
- Auto-deployment of Logentries agent across an autoscaling environment, managed using Chef. Logs and system performance metrics are now being collected from across your dynamic infrastructure.
- Your AWS account is configured to send CloudWatch and CloudTrail data to Logentries to provide additional data points that can be used to troubleshoot and investigate performance or security related issues.
- Some time later…a sudden shift in web page load time might trigger an anomaly alert in Logentries based off your Nginx logs.
- The alert can be set to different end points such as PagerDuty so that the right on-call person gets notified or to your communications tool (e.g. Slack) so that anyone online can reach accordingly
- The DevOps engineer may consult Logentries at this stage to see what the issue is, i.e. by checking the log event that triggered the alert, as well as the Logentries Dashboards to see if there were any strange trends across the system CPU, memory, error rates or user activity for example. The Logentries/New Relic Plugin might be used to switch into New Relic in the same timeframe to correlate the alert with performance data related to the transaction that triggered the alert.
- Still not satisfied, a more generic Ops dashboard can be consulted (e.g. Geckoboard) to look across data from a wider set of tools (e.g. key data from Logentries, New Relic, RayGun, Graphite).
The issue will likely get identified at some point along the above workflow so that a quick resolution can be put in place. This is a great example of why interoperability of DevOps tools is massively important to allow for quick problem resolution and to enable teams across an IT and Dev organization to work efficiently. This may seem fairly self evident, but what you may not have considered is that interoperability is also really important for tools within the same category. For example, we regularly come across end users using both ELK and Logentries as a hybrid logging solution. An example scenario might be:
- An organization decides to go the open source logging route using ELK as a low cost internal project.
- As logging volumes grow they need to either (1) deploy a larger server footprint to handle the increased logging load (e.g. an elastic search cluster) resulting in a more significant AWS bill or (2) use a SaaS logging service (e.g. Logentries) to allow a specialized provider to deal with this.
- It’s not un-common when option 2 is selected that a small ELK footprint will still remain within the users environment. In this case, data that is required for live analytics or alerting would generally be sent to Logentries with less time sensitive data remaining in the ELK instance, resulting in a hybrid logging solution, taking advantage of both the cost effectiveness of open source as well as the benefits of SaaS.
- Note both Logentries and ELK will allow you to archive any logs to S3 in case you need them at some future point. And in fact Logentries will allow you to re-ingest your logs back from S3 in case you need to perform any future analysis on this data.
If you are considering a hybrid logging solution, combining ELK or Logstash with Logentries, check out our new Logentries and Logstash integration which allows you to easily stream your logs from ELK to Logentries. You might also want to check out the Logentries Open API which allows you to easily get your logs back out of Logentries.