Last updated at Fri, 03 Nov 2017 20:07:20 GMT
Previously, we wrote about setting up a Windows environment to log JSON formatted logs using our Windows Agent or our DataHub. Now we’ll tackle IIS.
IIS, like Windows, has a unique log format that makes it difficult to read, parse, and garner useful information. The log is a flat file that has a line-per-web hit; similar to Apache or Nginx. But, it’s not as easy to format into JSON as Apache and Nginix.
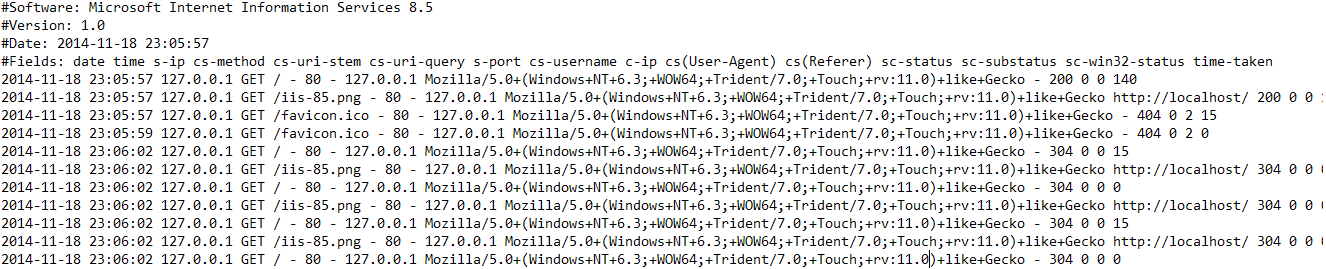
Using the tricks we learned formatting Windows Event Logs as JSON we can use the same tools to get IIS into JSON formatted logs, and use our more advanced analytics features.

Step 1: Setup NXLOG
If you haven’t followed the instructions on getting NXLOG setup on your Windows machine, we need to first install NXLOG. Installing NXLOG is as easy as downloading an MSI and clicking install.
Step 2: Configuration
Similar to the Windows JSON formatting, there are two separate configurations for IIS. Depending on whether or not you’re using the Windows Agent from Logentries or the DataHub – your configuration steps will be different.
DataHub/Syslog Configuration
This configuration file will assist in setting up NXLOG to use with the DataHub or direct syslog configuration.
First, copy the downloaded file to the NXLOG configuration path (typically C:\Program Files (x86)\NXLOG\CONF). Then, make the following changes to that file:
- If for some reason NXLOG gets installed to C:\Program Files instead of C:\Program Files (x86), you’ll need to uncomment the ROOT definition at the start of the config file for the proper installation directory.
- Change the EventLog format to mseventlog instead of msvistalog if you’re utilizing Windows 2003 or prior.
- Update the file location of IIS logs (on line 67 of the configuration file) to point to the location of IIS log files on the system.
- Enter in your DataHub IP and Port in the output definition at the bottom of the file.
- Start NXLOG from the Services application.
Direct Agent Configuration
Using the Windows Agent in Logentries has the added benefit of sending over system stats as well (CPU, Memory, Network, etc.) The configuration is similar, but has a few more steps to allow the Windows Agent to follow the JSON converted files.
You’ll need to download the NXLOG configuration file to use with the Agent, and place it into your NXLOG installation path.
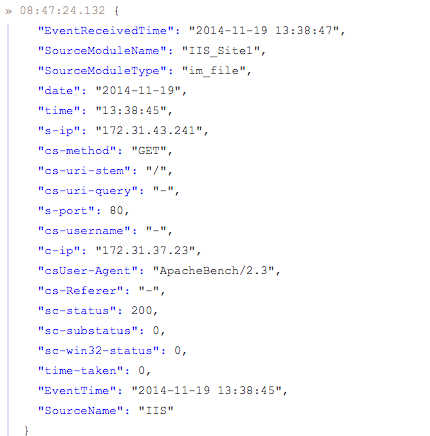
The NXLOG program acts as a JSON parser in this instance; reading in the IIS and Windows Event Logs and outputting to a flat file the Windows Agent can follow.
You’ll need to perform the following steps:
- If for some reason NXLOG gets installed to C:\Program Files instead of C:\Program Files (x86), you’ll need to uncomment the ROOT definition at the start of the config file for the proper installation directory.
- Change the EventLog format to mseventlog instead of msvistalog if you’re utilizing Windows 2003 or prior.
- Update the file location of IIS logs (on line 67 of the configuration file) to point to the location of IIS log files on the system.
- At the bottom of the file is an area where we feed the output file. Currently it’s outputting to both C:\Test\eventlog.txt and C:\Test\iis.txt. You’ll want to change this to a more suitable location that meets your needs.
- Start NXLOG from the Services application.
- Follow the files defined in step 4 with the Windows Agent – and uncheck the other Windows Event Logs from being followed.
Now, your IIS logs will be visible in JSON inside of Logentries – but even more importantly, the advanced analytics of Logentries can now be applied against your web traffic.
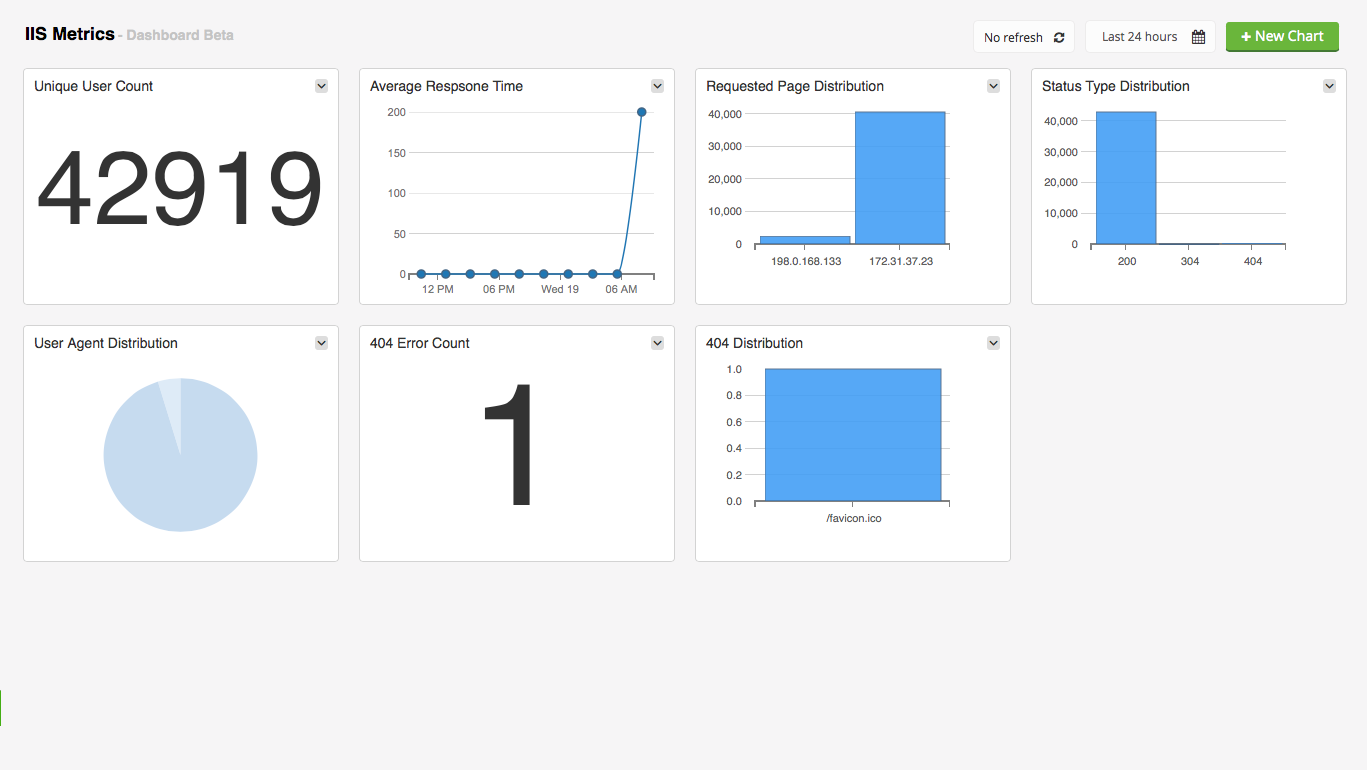
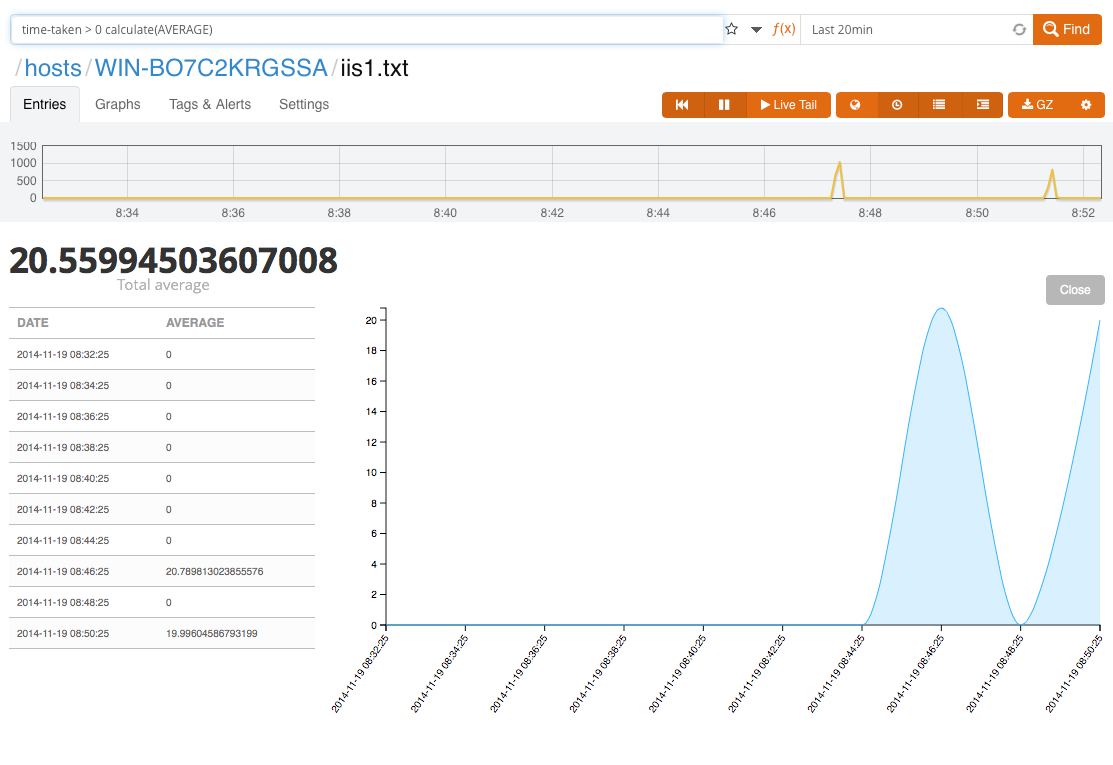
 Using our advanced analytics functions you can use our dashboards and graphs to map out your applications performance, response, and other key performance indicators.
 With our new Community Packs for IIS you can now import all important queries, dashboards, and tags for IIS with a click of a button. The IIS pack contains queries for numbers of 404, average response time, accesses per hour, and more!