Last updated at Fri, 03 Nov 2017 21:10:57 GMT
“a·nom·a·ly”
1. Deviation or departure from the normal or common order, form, or rule.
When someone is looking to be alerted when something unexpected happens within their environment they are usually referring to anomaly detection. But the problem is that it’s hard to turn a complex problem (i.e. looking for something when you are not sure what it is) into an easy to use solution.
The thing about anomaly detection is that you don’t know how the issue will present itself so predicting the pattern to look for becomes very difficult. In fact it could be argued that the number of patterns and permutations that need to be monitored trends toward infinity the more event types you have and it might take a while to create all those individual monitoring tasks.
So what we have done is built 2 new ways of monitoring your logs/being alerted when something happens that wasn’t expected. BUT, what we have done differently, is that we have tried to make these as easy as possible to use.
Inactivity alerting
As the name implies, this is essentially the activity of alerting on inactivity. Often silence is one of the most important events in the world of machine-generated data, for when things go quite then its time to shout.
So inactivity is usually the result of a bigger problem manifesting within a system, anything from a service to a whole system going down. We have created inactivity alerting so you can be alerted if such an occurrence happens.
Imagine:
You have lots of logs from lots of servers and a great load balancing system sitting in front of them. This load balancing system is so good that if a server goes down that it will not affect availability in any shape or form.
So unless you are monitoring your servers with a specialized service you may not be aware of the individual machines outage. But by using our inactivity alerting you can be alerted if a machine or service stops logging events for a specified period of time. When you combine this with our existing alerting system you now have a single alerting tool that gives wide alerting coverage over issues encountered within your application – as well as if there are any issues on the servers that application is running on.
Anomaly Alerting
Our new anomaly alerting service is our other new piece of alerting functionality aimed at helping you be aware when your system acts in an unexpected manor.
We have tried to make this as easy as possible to use, and so we allow you to use our search functions to extract computed data from your logs and then compare this to the same time period a week ago and see if there was any difference.
So this gives you the ability to quickly identify unexpected spikes or troughs in important data within your logs.
Example:
Consider an example security alert where you want to make sure that there is not an unexpected spike in failed log-ins (someone trying to gain access). But you can’t keep setting manual thresholds as your user base is continually growing so these thresholds would fast become out of date. Also the activity of your user base varies greatly between day and night so a threshold for daytime activity may not match what you want for nighttime activity.
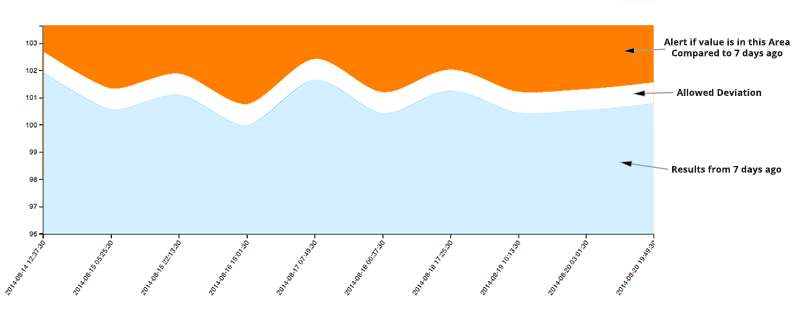
But by using our anomaly detection you can specify that the count of failed logins for a period of X time should not deviate more than 5% on the same period last week. This way the alerting system will only look for anomaly’s over the exact same time last week and will not be comparing to a fixed number.
Sample AWS event log
{“eventVersion”:”1.01″,”userIdentity”:{“type”:”Root”,”principalId”:”635132405155″,”arn”:”arn:aws:iam::6314112445155:root”,”accountId”:”417774155155″},”eventTime”:”2014-08-14T13:58:30Z”,”eventSource”:”signin.amazonaws.com”,”eventName”:”ConsoleLogin”,”awsRegion”:”us-east-1″,”sourceIPAddress”:”127.250.115.178″,”userAgent”:”Mozilla/5.0 (Macintosh; Intel Mac OS X 10_9_4) AppleWebKit/537.77.4 (KHTML, like Gecko) Version/7.0.5 Safari/537.77.4″,”requestParameters”:null,”responseElements”:{**<span style="text-decoration: underline;">“ConsoleLogin”:”Failure”</span>**},”additionalEventData”:{“MobileVersion”:”No”,”LoginTo”:”https://console.aws.amazon.com/billing/home?state=hashArgs%23%2Faccount&isauthcode=true”,”MFAUsed”:”No”},”eventID”:”a41245s1-a1ee-4ac8-b67c-8462a67a3998″}
Sample Query
“ConsoleLogin:Failure CALCULATE(Count)”
This means you can simply set the alert and know that it will grow and monitor your logs and system without you having to continually alter thresholds and that it will adapt to daily and hourly deviations.
So by providing these 2 new types of alerts, it now means that with Logentries you have a complete suite of alerting functionality to facilitate just about all the requirements your traditional operations team would come to require.
See – Easy peasy lemon squeezy.