Last updated at Mon, 06 Nov 2017 16:38:55 GMT
At re:Invent last year AWS launched CloudTrail, which is essentially a “trail” of all activity in your AWS Cloud environment… the clue is in the name ;). CloudTrail has been widely accepted as a great addition to the AWS toolset as it is useful for numerous use cases including security analysis, troubleshooting, tracking of AWS resource usage, and more.
While CloudTrail is a rich data source that contains invaluable information, we’ve realized from working with our customers that it is only one data point that often needs to be correlated with resource usage information, application performance metrics, system logs etc. to get a complete picture of your AWS environment and account activity. To help here we’ve made it easy to combine CloudTrail, CloudWatch and your application and system logs from your AWS environment in one single location within your Logentries account.
Step 1: Send your logs
Use our AWS connector script to easily configure all your AWS log data from any Ec2 instances you have to your Logentries account. Alternatively select your OS version during setup and follow the instructions to send in your OS and application logs.
Step 2: Configure CloudTrail & CloudWatch:
By providing the relevant AWS IAM credentials, Logentries can stream your CloudTrail and CloudWatch data as log data streams into your Logentries account. The logs are indexed and analyzed like any other log in your Logentries account so you can easily search across them, create tags or alerts or make use of our search functions for that matter.
Step 3: Correlate your Data
Once you have your app logs, OS logs and CloudTrail and CloudWatch data streaming into your Logentries account, you can now begin to correlate, slice, and dice your data.
When might you want to do this? Some examples that spring immediately to mind:
Troubleshooting: Consider a situation where there has been a sudden increase in response time of your service as reported by customers via your customer support channel.
- The first thing you might do here is check out your application logs to validate that response time is in fact over a reasonable threshold. Usually your web server or better still your client side logs will report the time it has taken for a request to be satisfied.
- As a second step it would make a lot of sense to investigate if the increase in response time is a result of increased load on the system or due to some bug or issue. Checking your system monitoring information (i.e. CloudWatch) can tell you if Network traffic or CPU is starting to spike, or if you are running low on other resources (e.g. memory/disk). If indeed there has been a sudden increase in CPU for example you might next want to check if anything has changed in your system.
- This is where CloudTrail can be super useful to figure out if your pool of servers has been reduced in size for example. CloudTrail tracks specific user actions in your AWS account such as somebody starting, stopping, rebooting or terminating an instance. In this example CloudTrail could have validated that one of your DevOps team had inadvertently reduced the size of your server pool, resulting in increased load in your infrastructure and thus slower response times for your customers.
Security Analysis: Consider a situation where you are alerted about a change in a security group setting or a change to a user’s permissions as recorded in your CloudTrail log. (Note: Logentries provides out of the box team based alerting for CloudTrial on important events such as when EC2 Security Groups are created, deleted, or edited; New IAM users are created; User’s IAM permissions are changed so that you and the right members of your team can get notified on important security events).
- CloudTrail can give you an indication that something might be awry, but you will likely want to analyze your auth logs to investigate if anyone has attempted to, or successfully logged into, any servers on your infrastructure; and, if they did, what actions they carried out. This is again a great example of where having both your CloudTrail information alongside system log data can be super useful for quick and efficient investigation so that you can identify and get to the bottom of any usual behavior.
Logentries allows you to make these correlations at a very fine-grained log level where you can use our Aggregate View to dynamically combine log sources into a single aggregate view. With the aggregate view multiple logs are dynamically correlated in real time by time stamp so you can easily identify events from different sources that might be related.
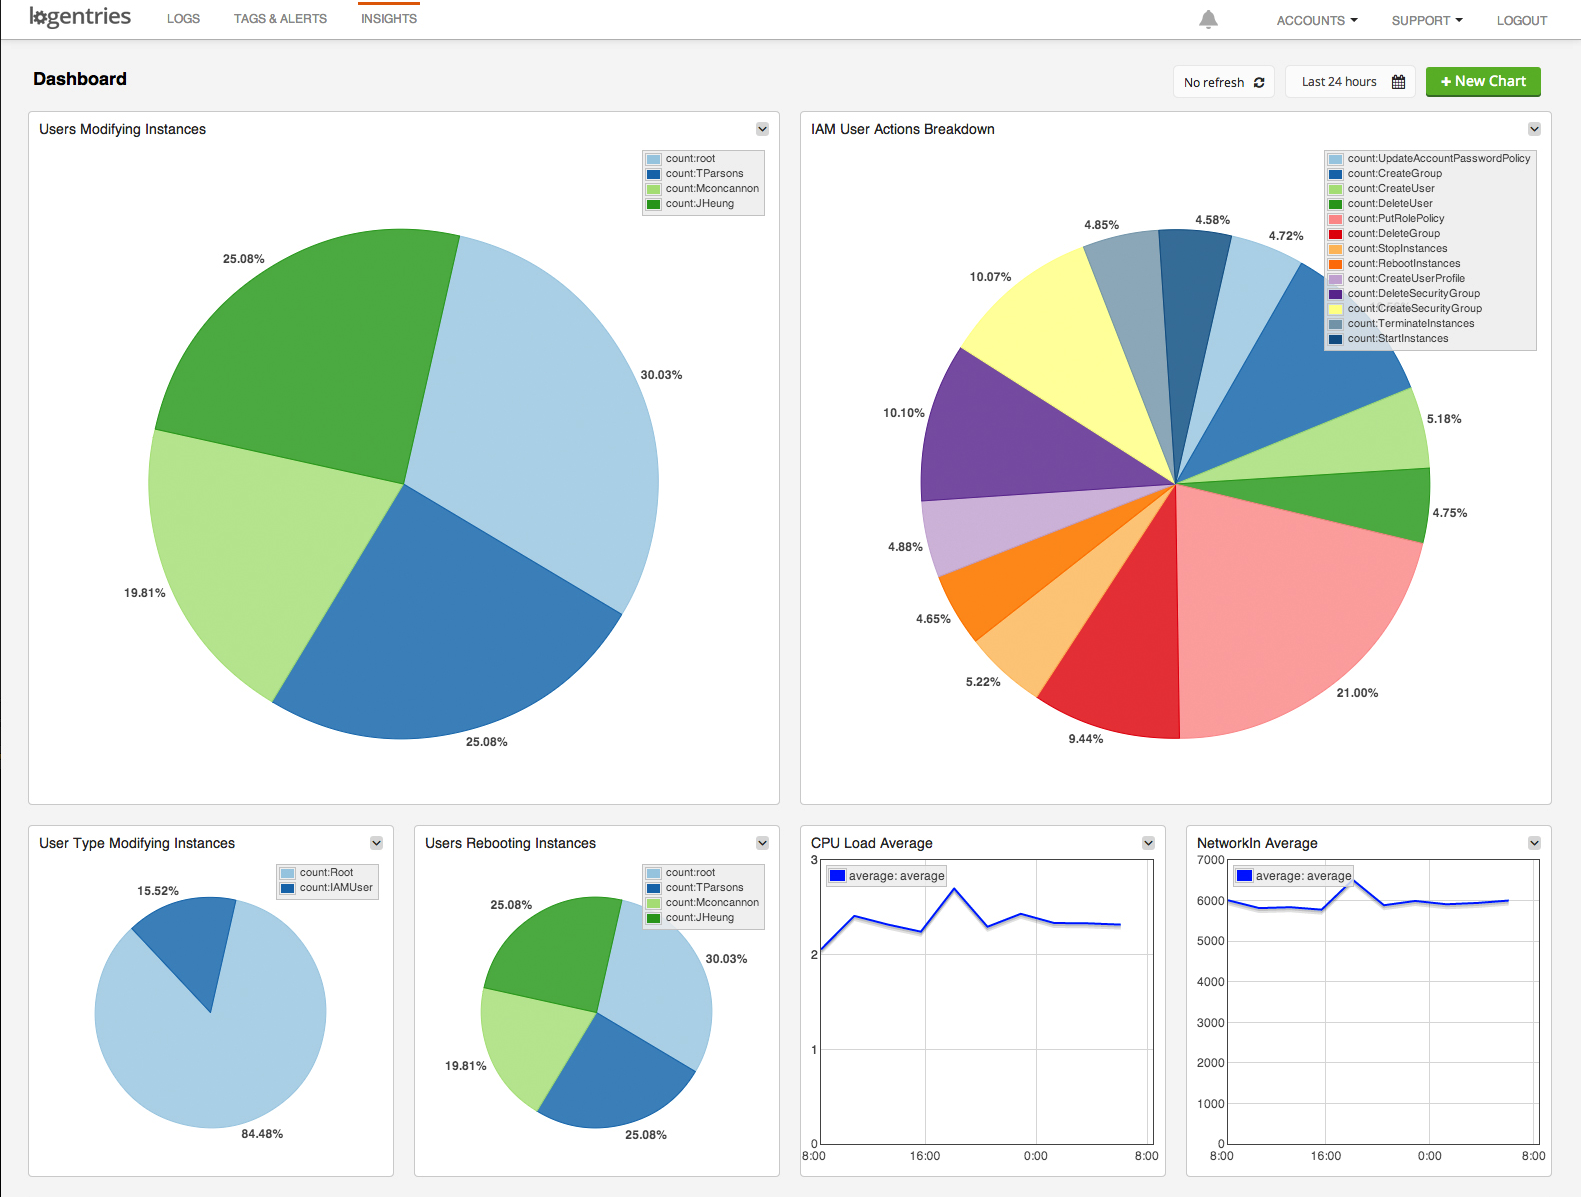
You can also use our search functions to create visualizations across CloudTrail, CloudWatch and your system logs (as in the screen shot above) and save these in our dashboard for example. You can also set a refresh period on the dashboard so that it updates periodically – in case you want to use it as an operations dashboard that your team can use keep an eye on your key metrics.
Check it out by signing up for a free account and hooking up your AWS logs, CloudTrail and CloudWatch data.