Last updated at Thu, 07 Dec 2023 20:29:28 GMT
As a part of monitoring and troubleshooting our system and applications, we often need to get a quick snapshot of information about the status of our server. This usually means SSHing into a server and running certain commands to get to the information we need. I wanted to share a quick overview of my top 5 commands to get a snapshot of this server information.
htop is an ncurses-based interactive process viewer for Linux. It gives information about the CPU utilization, processes running, uptime and load.
[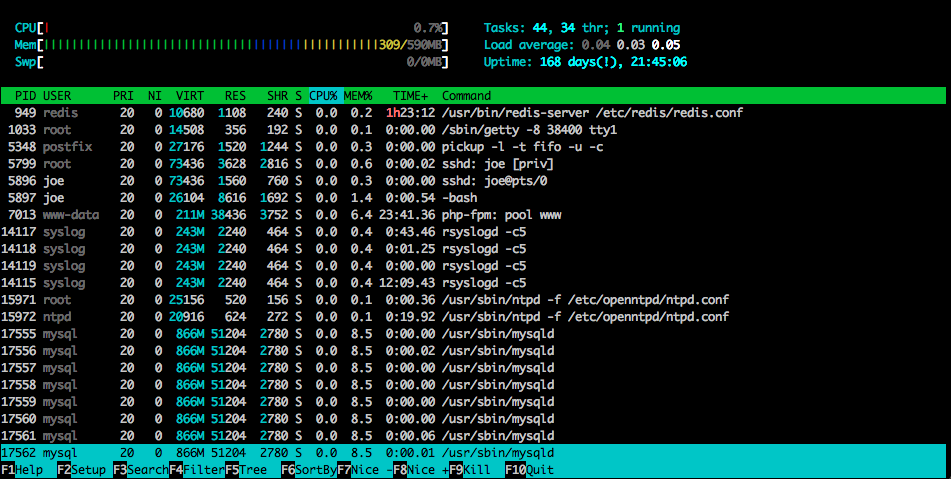
Some of the advantages of using htop over top include:
- colored output
- kill processes without typing pids
- sorting by
- searching
- filtering
iotop is a an application similar to top which is used to show information about disk I/O. It looks at I/O usage information and displays the current I/O usage by processes or threads on the system.
[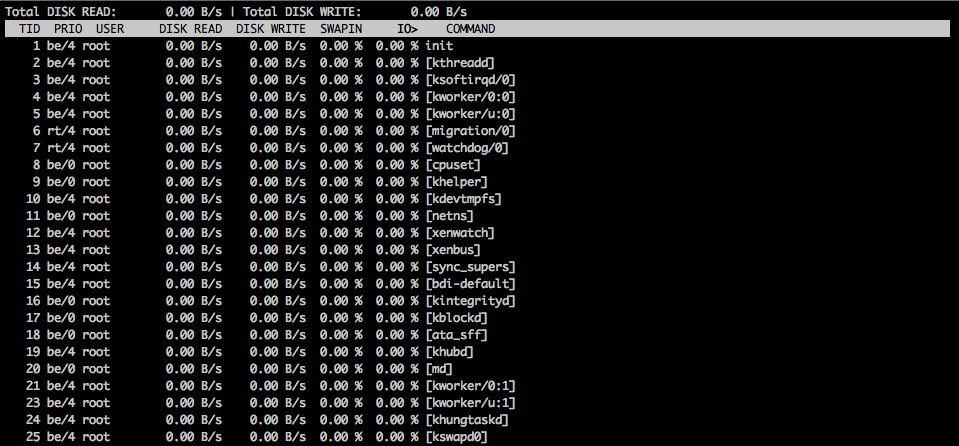
The great thing about iotop, especially for applications with very high IO, is that it allows you to view which processes are consuming the most disk IO and the total of all disk IO at that time.
vnstat is a tool for displaying and logging network traffic of different interfaces on your systems. vnstat is great because it doesn’t add any extra load to your system as it uses the network statistics provided by the kernel.
[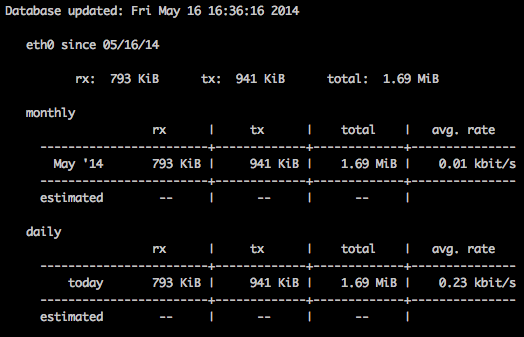
Some of the arguments that come in handy for this one are:
- -h, –hours show hours
- -d, –days show days
- -m, –months show months
- -w, –weeks show weeks
- -t, –top10 show top10
- -tr, –traffic calculate traffic
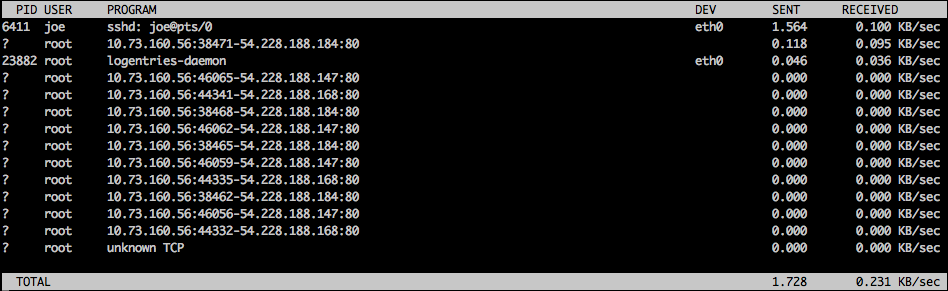
Nethogs is very handy tool to trace network traffic. It shows you which processes are using the most bandwidth, instead of showing bandwidth per interface or protocol as most similar programs do. It’s very easy to trace which applications are stealing your networks I/O.
[
netstat
netstat is a powerful tool for network statistics. You can trace network connections and interface statistics very easily. This tool can help you to find security holes in your system by showing all open ports and also shows you which processes opened these ports.
[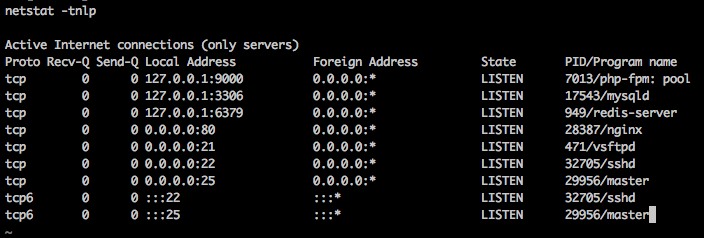 netstat is great to figure out if a process is listening on a specified port and if it is listening locally only (127.0.0.1) or open to everyone (0.0.0.0).
Those are my top five – what are yours?