Last updated at Mon, 06 Nov 2017 17:46:27 GMT

Last week I wrote “In Defense of the Agent.” One of the main advantages of using agents is the ability to easily get the agent configured to monitor logs of any type no matter where those logs live on your file system. We posted the article on Reddit and there were some interesting comments and discussion – it’s fairly obvious that there is a real love/hate relationship with agents – you either love ’em or hate ’em 🙂 One of the contributors did a great job of summing up the reasons why there may be some agent haters out there:
“More agents means more starting dependencies, slower boot times, more vulnerabilities to patch, and more resources consumed by idle processes.”
That being said, at Logentries, we provide both agent and agentless options for configuring your log data. And, despite what some have said about agents, we still see a high percentage of users selecting agents due to the extra functionality they provide and ease of setup. The approach we take at Logentries is to provide an array of options for our users and let them decide what’s best for them – we’d rather not dictate that you should or should not use agents – we’ll let you make that choice.
So staying true to our word, this week I’m going to cover agentless logging and how to configure Rsyslog to easily monitor your systems.
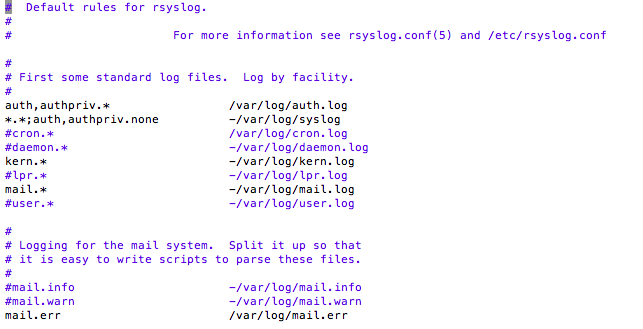
One of the main blockers we see with using Syslog in general is getting it setup, especially if you want to collect data from non-Syslog files – i.e. log files that Rsyslog has not already been configured to collect data from out of the box. By default Rsyslog is usually configured to get a bunch of OS logs. Here’s a view of my /etc/rsyslog.d/50-default.conf file (i.e. my default Rsyslog configuration) from an AWS ubuntu instance I spun up. You can see it is configured to gather all the standard linux log files produced by the kernel.
Next we are going to show how to send this data to a third party logging service without using an agent, as well as how to configure Rsyslog to also send data from files not part of the default configuration. Sending non-default Syslog data is in fact not really possible with some of the older versions of Syslogd. Thankfully, though, most modern linux distros ship with Rsyslog which has some nice additional functionality that provides the ability to convert any standard text file into a Syslog message.
First you’ll need to find out what flavor of Syslog you are actually running. To do so open up a terminal window and run the following:
ps aux | grep syslog
Here’s what I got when I ran this on an Ubuntu instance on AWS:
 As you can see I have Rsyslog running. Next I’m going to walk through a 3 step guide to help you start monitoring any log file on your system using Rsyslog:
- Step 1: Create the log files in your Logentries account
- Step 2: Configure Rsyslog on your server to forward logs to Logentries
- Step 3: Restart Rsyslog on the host
Step 1) Create Log Files for Dynamic Routing
Logentries is unique in that, unlike almost all other log management providers, it does not simply throw all your log data into a single bucket and then give you a search bar and search language to allow you to dig into them. Logentries instead allows you to dynamically route your log data from your file system into corresponding log files in your Logentries UI.
 You can thus create a one to one relationship with your actual log files and can easily navigate these as if you are navigating logs on your file system. You can also click your way to your data without the need for the creation of complex search queries.
To create this one to one mapping, you will need to create log destinations within the Logentries UI for each log that you want to follow on your server. You can do so by following these steps:
- Choose “+ Add new log”
- Choose “Manual configuration”
- Enter a “Name” you want the log to be identified as.
- Select option “Token TCP” from “Log entries are sent via”
- Select option “Default time period”
- Leave “Log Type” blank
- Select “Register new log”
- A token is then generated (store this for later use) and the log is added to the host on the Logentries UI and the token is also available from there
Repeat the steps above for each log file you want to monitor. Note this one to one mapping can also be set up using our API to remove the manual process.
Step 2) Configure your Host to Forward Logs to Logentries
The following is required to configure each host:
- Create an empty file ”/etc/rsyslog.d/logentries.conf” and add the details below, while replacing TOKEN_HERE with the token we just generated for a log file on Logentries and then save the file:
$template LogentriesFormat,"TOKEN_HERE %HOSTNAME% %syslogtag%%msg%\n" . @@api.logentries.com:10000;LogentriesFormat
This will tell Rsyslog to forward all the default Syslog log data to the log file you created in Step 1. At this point you can jump to step 3 below if you like, and restart Syslog to see log data streaming into your account. Alternatively if you’d like to also be able to send non-Syslog data into your account via an agentless approach – follow the remaining steps below:
- To forward data from log files other than the standard Syslog log files (e.g. Apache logs, Websphere logs, DB logs) you will need to add additional details for each log file you would like to add to the “/etc/rsyslog.d/logentries.conf” file. Note you should create a corresponding log file in the Logentries UI for each additional log file you want to monitor using Rsyslog. Follow the instructions above in Step 1 for each additional log file and keep a note of the token.
- Below is an example of a logentries.conf file that contains the details you need to also forward data from (for example) Websphere error and systemout logs. Each log file you create in the Logentries UI will have a unique TOKEN value that you will need to fill in below in lines beginning with ‘$template’**, **giving a different TOKEN for each template. I’ve commented the file so you can get a feel for what is happening here.
$ModLoad imfile

#variables required for non-syslog log file forwarding – SystemErr
$InputFileName /var/log/IBM/Websphere/AppServer/SystemErr.log
$InputFileTag websphere-errors
$InputFileStateFile websphere-errors
$InputFileSeverity error
$InputFileFacility local7
$InputRunFileMonitor

#variables required for non-syslog log file forwarding - SystemOut
$InputFileName /var/log/IBM/Websphere/AppServer/SystemOut.log
$InputFileTag websphere-systemout
$InputFileStateFile websphere-systemout
$InputFileSeverity info
$InputFileFacility local7
$InputRunFileMonitor

###########################################
#Add details for any more non-syslog log files here
#Copy the variables above for each file you want to add
###########################################

#Set how often you should poll for new events, default is 10sec
$InputFilePollInterval 10

###### Creates a template for each log file in the Logentries UI
###### And appends the token to each log event.
###### Replace 'TOKEN_HERE' with the relevant log token in Logentries (from step 1)
$template SyslogTemplate,"TOKEN1_HERE %HOSTNAME% %syslogtag%%msg%\n"
$template WebsphereErrorsTemplate,"TOKEN2_HERE %HOSTNAME% %syslogtag%%msg%\n"
$template WebsphereOutTemplate,"TOKEN3_HERE %HOSTNAME% %syslogtag%%msg%\n"

### logic to apply the relevant templates to the different log files
if $programname == 'websphere-errors' then @@api.logentries.com:10000;WebsphereErrorsTemplate
& ~

if $programname == 'websphere-systemout' then @@api.logentries.com:10000;WebsphereOutTemplate
& ~

*.* @@api.logentries.com:10000;SyslogTemplate
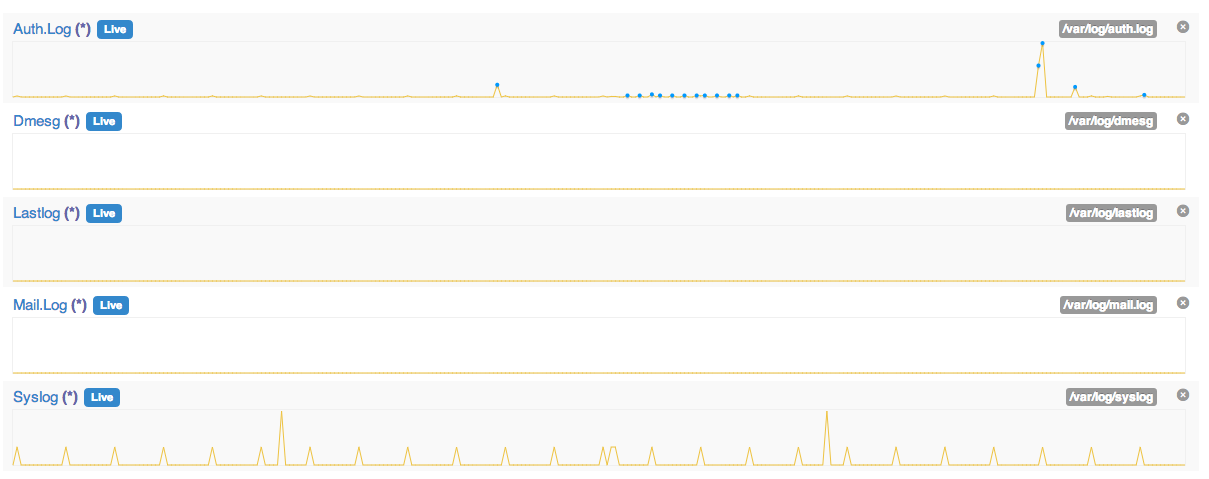
The end result is that the standard Syslog logs, and (in this case) my websphere SystemOut and SystemErr logs will be sent to different logs in my Logentries account.
Step 3) Restart Rsyslog on the Host
Finally you will need to restart Syslog:
sudo service rsyslog restart
Running the following command from the terminal will send some sample logs into your Syslog log files:
logger this is a test 1
logger this is a test 2
logger this is a test 3
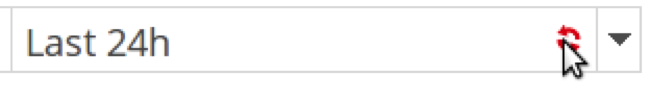 To see new logs entering your account select the refresh button next to the drop down time range menu. Logs should appear in your account within a few seconds. Alternatively, use our live tail feature to view the logs streaming in from your server in real time.
Ready to start getting insights from your applications? Sign up for a free trial of Logentries today.